
Figure 3.
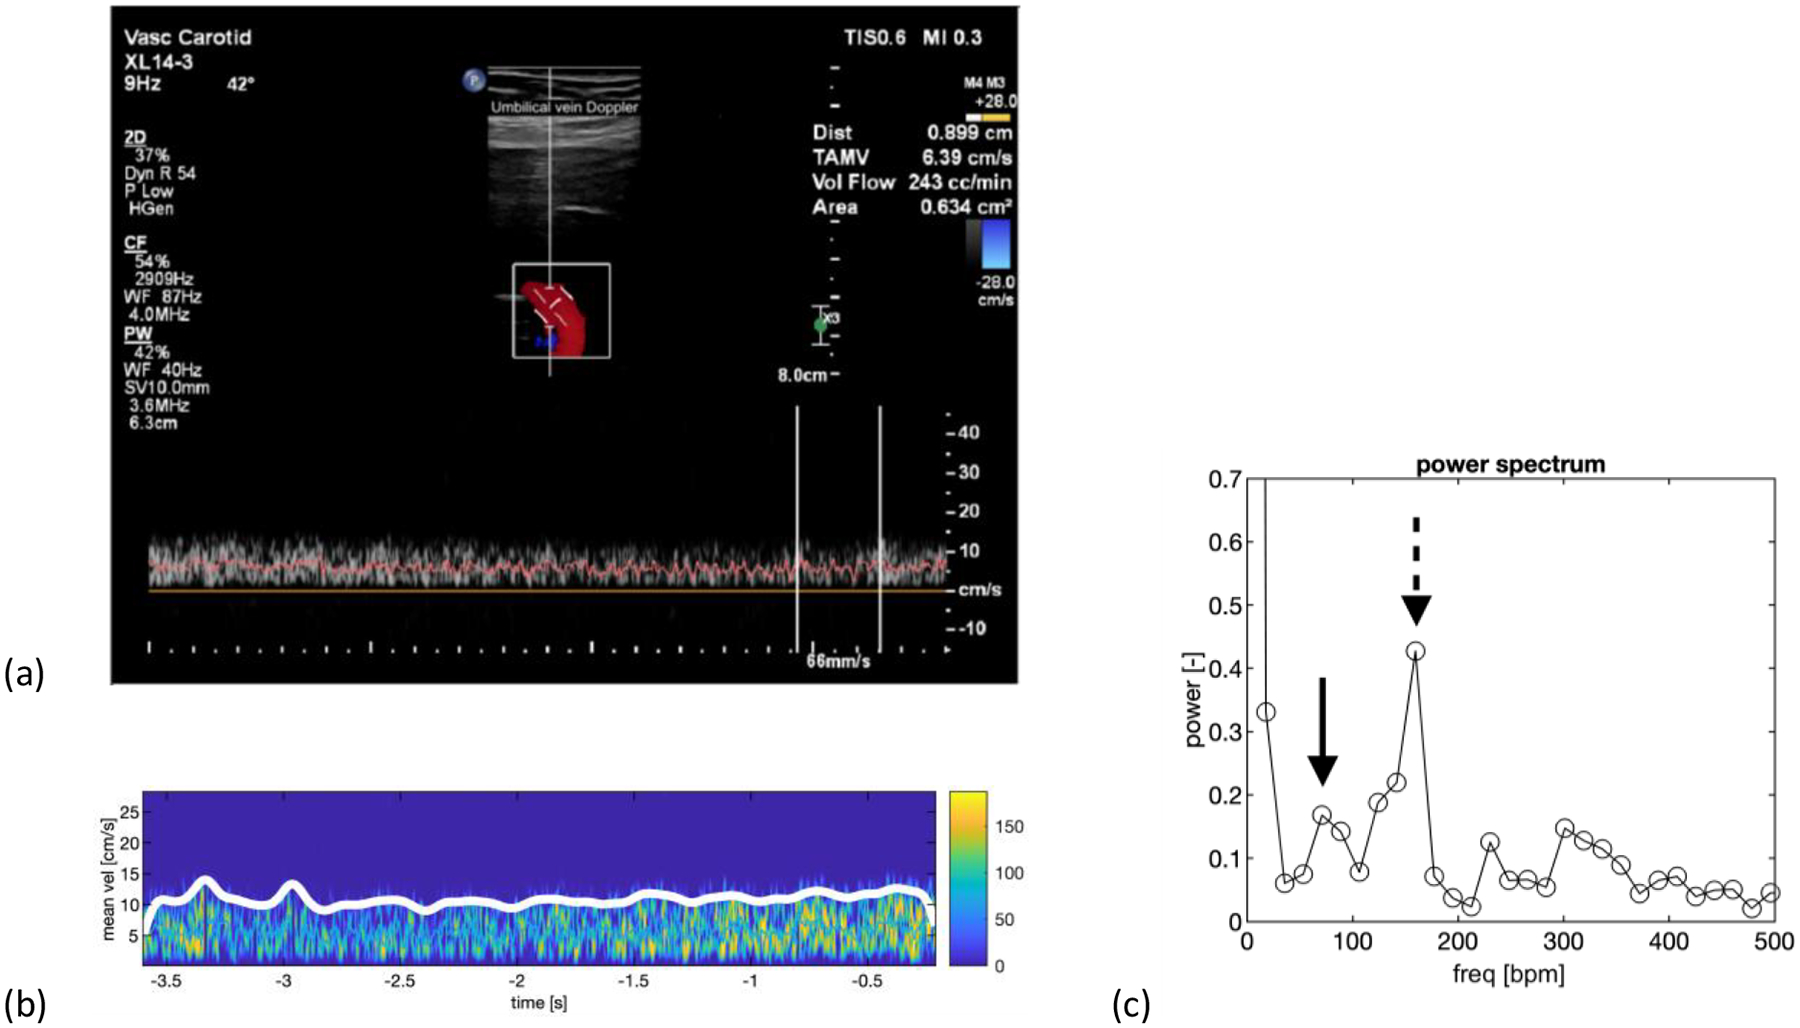
Patient with 26-week 5-day fetus with IUGR. The patient also had pre-eclampsia. a) Duplex spectral Doppler showing the venous spectrum as well as an angle corrected 2D color Doppler image with a Doppler angle of 42 degrees. b) A colorized version of the venous spectrum with the envelope trace along the upper edge of the spectrum in white. c) Power spectrum showing a peak (dashed arrow) at 160 beats per min corresponding to the fetal heart rate. The spectral power at the point is 0.427. The maternal peak (solid arrow) is at 71 beats per min with a spectral power of 0.168, which is less than the fetal peak. Note: The vertical axis is zoomed in to improve the visibility of the maternal and fetal spectral components, thus the zero-frequency peak (DC) is not shown. ‘bpm’ equals beats per minute.