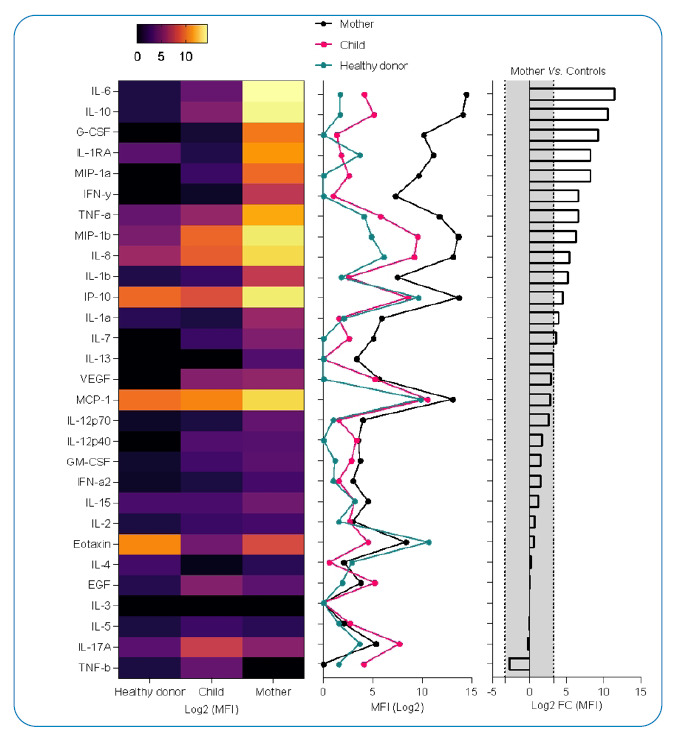
FIGURE. 2: Cytokine storm signature in the plasma sample of a Plasmodium vivax and SARS-CoV-2 co-infected-patient (mother). (A) Heatmap showing log2 of median fluorescent intensity (MFI) levels. (B) Line plot showing log2 of MFI levels. (C) Bar plot showing log2 of fold change calculation of MFI levels of P. vivax and SARS-CoV-2 co-infected-patient (mother) vs. mean of MFI levels of the healthy donor and P. vivax-infected patient (child); the gray area represents a <10-fold change absolute value. EGF: epidermal growth factor; G-CSF: granulocyte colony-stimulating factor; GM-CSF: granulocyte-macrophage colony-stimulating factor; IL: interleukin; IFN: interferon; MCP-1: monocyte chemoattractant protein-1; TNF-a,-b: tumor necrosis factor-α, -β; VEGF: vascular endothelial growth factor.

