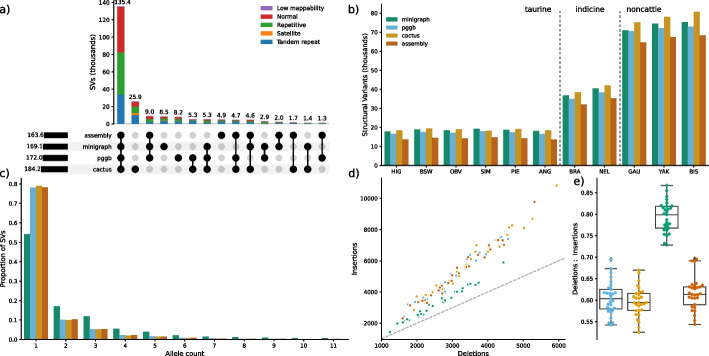
Fig. 2.
Consensus of structural variation between three pangenomes. a Overlap of SVs between three pangenomes and assembly-based SV discovery. Overall bar height represents the total number of SVs. Variants in different classifications of genomic regions are indicated by colour of the stacked bar. b Number of SVs identified in the input assemblies through assembly-based mapping and the three pangenomes. c Allele count of the SVs (colours described in panel b). d, e Number of and ratio between deletions and insertions recovered from the pangenomes and assembly-based mapping (colours described in panel b)

