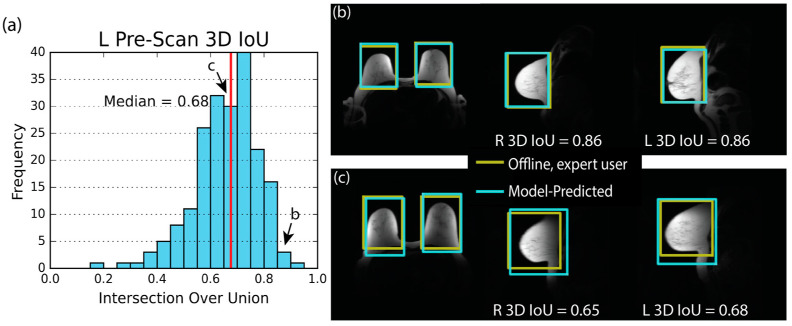
Figure 4.
The pre-scan volume 3D intersection over union (IoU) histogram, (a), and the two examples, (b,c), demonstrate that the model can predict a pair of pre-scan volumes that closely match the offline, expert-placed pre-scan volumes. The histogram shows results of the left (L) volume only. However, the right (R) volume’s distribution is similar. The red line indicates the median value of 3D IoU. In (b,c), the yellow box shows the expert-user-placed volume generated in an offline setting. The blue box shows the model-predicted volume. (b) shows an excellent case with a high 3D IoU for both pre-scan volumes. (c) shows the median performing case.

