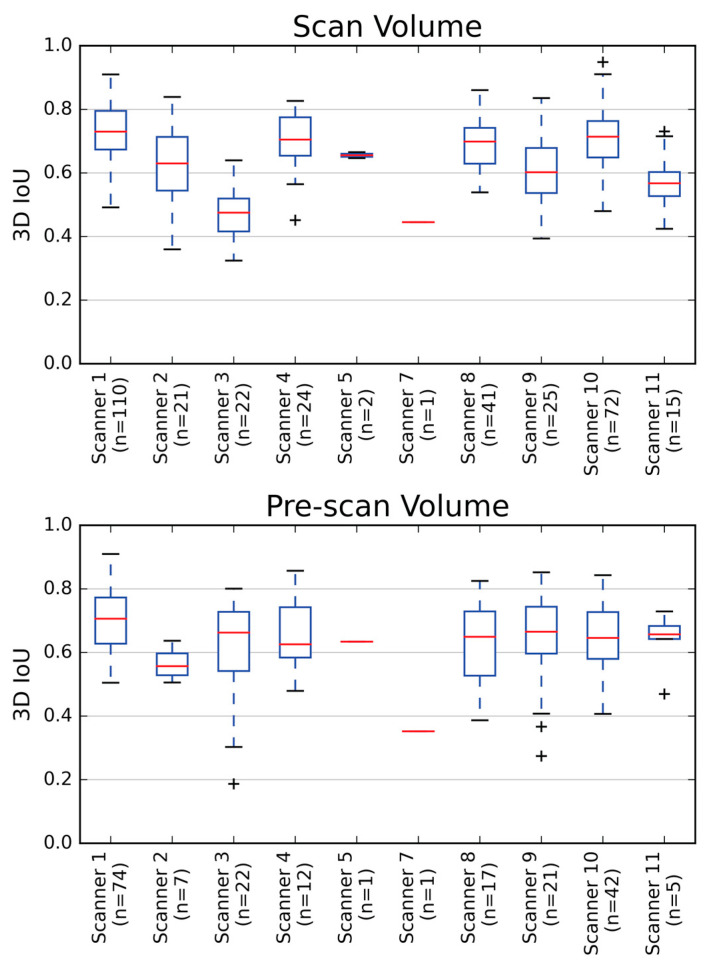
Figure 5.
Average 3D intersection over unions (IoU) for both scan volume and pre-scan volumes were good across multiple scanners from which the data were obtained. 3D IoU performance on each scanner is displayed using box and whisker plots. Red horizontal lines represent the median values and ‘+’ indicates data outliers. The 3D IoU for the left pre-scan volume only is shown. The right pre-scan volume showed similar behavior. Generally, scanners with a larger number of cases tended to have higher 3D IoUs.

