Figure 2.
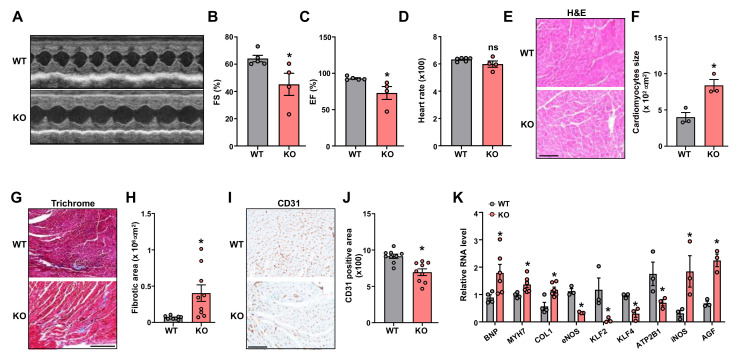
Leene-KO mice show impaired heart function in AngII model. (A) Representative M-mode images of echocardiography from WT and leene-KO mice with Ang II infusion on Day 27. (B–D) Fractional shortening (FS), ejection fraction (EF), and heart rate (n = 4–5 mice per group). (E,F) Representative images of H&E staining of heart. Quantification of the size of cardiomyocytes (n = 3 mice per group). (G–J) Representative images and quantification of Masson Trichrome staining (G,H) and immunohistochemical (IHC) staining of CD31 (I,J) in the heart. Three fields of view were randomly selected per animal, and three mice per group were quantified. (K) qPCR analysis of mRNA levels of genes as indicated in the heart, with 36B4 detected as the internal control (n = 3–6 mice per group). Scale bars = 100 μm (E,I) and 250 μm (G). Data are represented as mean ± SEM. * p < 0.05 based on two-tailed Student’s t-test.

