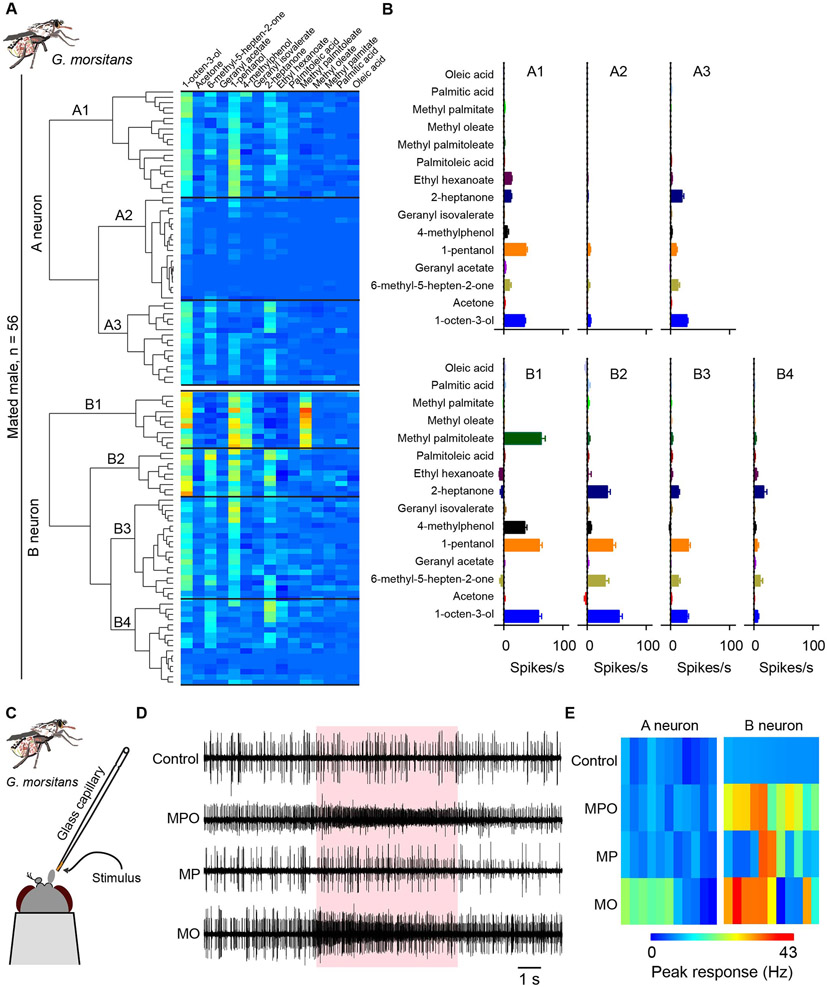
Figure 5. ORNs that respond to MPO also respond to known G. morsitans attractants.
(A) Heatmap based on hierarchical cluster analysis of responses of male trichoid sensilla to a panel of 9 odorants and the 6 newly identified compounds. In the heatmap, each horizontal row represents 1 trichoid sensillum, and each vertical column represents 1 of the olfactory stimuli. The classification was carried out with Ward’s method. The 9 odorants were diluted 10−2 in paraffin oil; the six compounds were diluted 10−1 in paraffin oil. (B) Response profiles of neuronal classes in trichoid sensilla; means ± SEM. n values range from 9-20, as shown in panel A. (C) The close-range stimulus delivery system. The stimulus is placed ~1 mm from the antenna, at the end of a glass capillary. (D) Example traces of electrophysiological responses of male trichoid sensilla to MPO (neat), MP (neat), and MO (10−1 dilution). MPO and MP elicit an increase in the frequency of the small spikes (B neurons); MO elicits an increase in the frequency of both small and large spikes (B and A neurons). (E) Heatmaps of electrophysiological responses of A and B neurons to MPO (neat), MP (neat), and MO (10−1 dilution) in males. Responses are peak responses.

