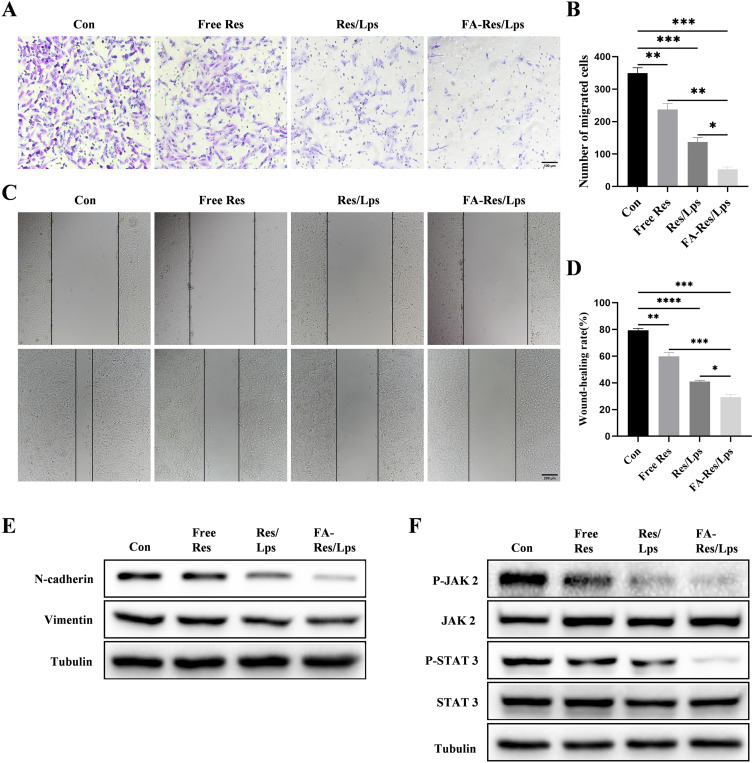
Figure 3.
Cell migration and associated signalling pathways in FA-Res liposome-treated osteosarcoma cells. (A and B) Representative images and quantitative data of transwell analysis of 143B cells after 24 hours of treatment with control, free Res, Res liposomes, and FA-Res liposomes, respectively. (C and D) Wound healing of 143B cells after 0 h and 24 h of treatment with control, free Res, Res liposomes, and FA-Res liposomes, respectively, was photographed and their relative healing rates were calculated. (E) Expression of N-Cadherin and vimentin protein in 143B cells were analyzed by Western blot. (F) Expression of P-JAK 2, JAK 2, P-STAT 3, and STAT 3 proteins in 143B cells were analyzed by western blot. All data are expressed as mean ± SD (n=3). *p<0.05, **p<0.01, ***p<0.001, ****p<0.0001.

