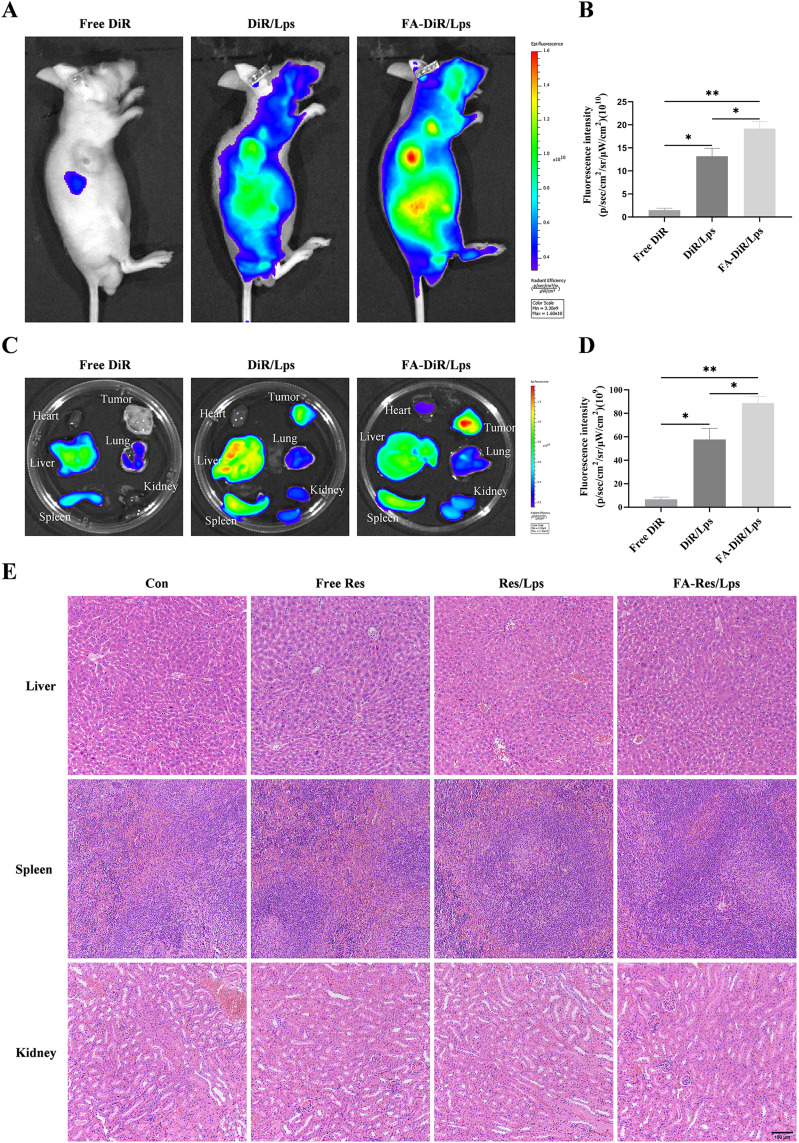
Figure 4.
Biodistribution of FA-DiR liposome treatment in 143B xenograft mice. (A and B) Representative in vivo fluorescence images and quantification of fluorescence intensity of DiR-loaded liposomes in 143B cell-induced xenograft mice. (C and D) Representative fluorescence images and quantification of fluorescence intensity of organs and tumors in mice 24 hours after DiR injection. (E) Representative HE-stained images of liver, spleen, and kidney tissues from each group of transplanted tumor model mice. All data are expressed as mean ± standard deviation (n=3). *p<0.05, **p<0.01.

