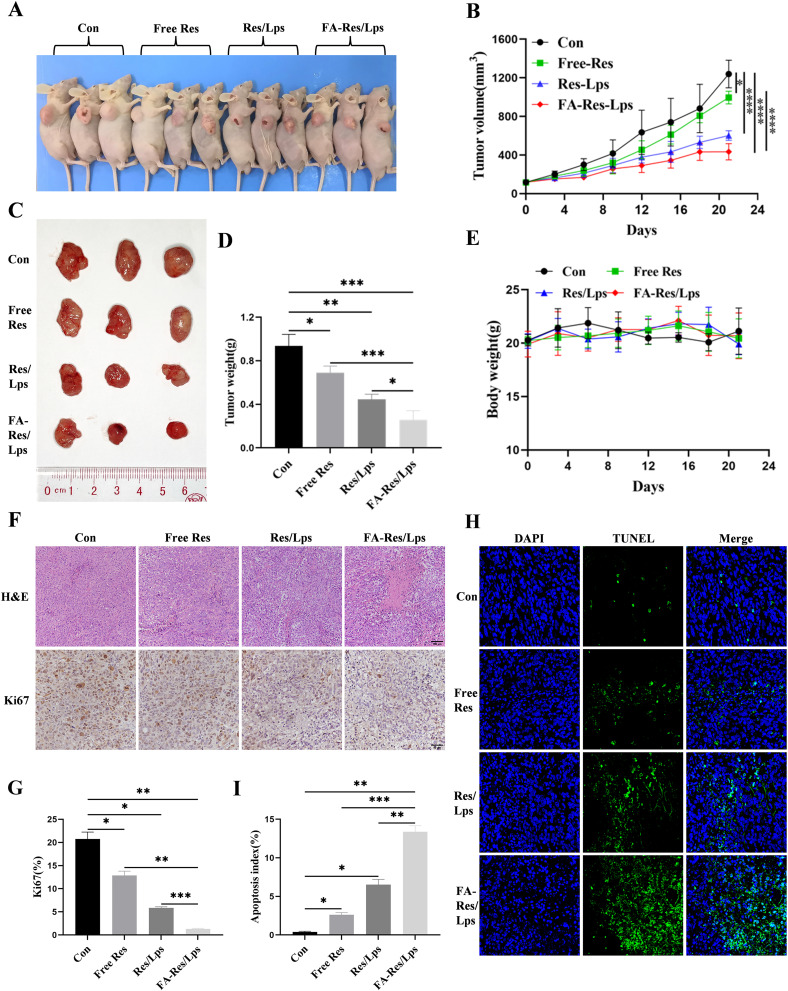
Figure 5.
Antitumor effect of FA-Res liposomes treatment in 143B xenograft mice. (A) Representative in vivo animal photographs of 143B-induced xenograft tumor-bearing mice. (B) Curves of changes in subcutaneous tumor volume in each group. (C) Photographs of each group of subcutaneous tumors. (D) Weight of each group of subcutaneous tumors. (E) Body weights of transplanted tumor-bearing mice treated with control, free Res, Res liposomes, and FA-Res liposomes, respectively. (F) Representative HE staining images and Ki67 immunohistochemistry images of each group of tumors. (G) Quantitative Ki67 immunohistochemistry data for each group of tumors. (H and I) Representative TUNEL staining images and quantitative TUNEL staining data for each group of tumors. All data are expressed as mean ± standard deviation (n=3). *p<0.05, **p<0.01, ***p<0.001, ****p<0.0001.

