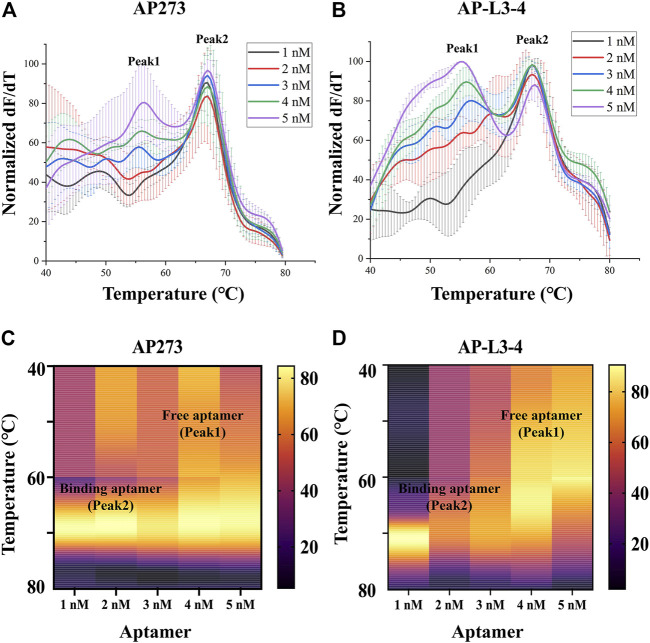
FIGURE 2.
Thermofluorimetric analyses of the refined gradient concentrations of aptamers binding to AFP. (A) Melting curves of AP273 at 1–5 nM. (B) Melting curves of AP-L3-4 at 1–5 nM. (C) Heatmap of the area under the peaks of AP273 at 1–5 nM. (D) Heatmap of the area under the peaks of AP-L3-4 at 1–5 nM.

