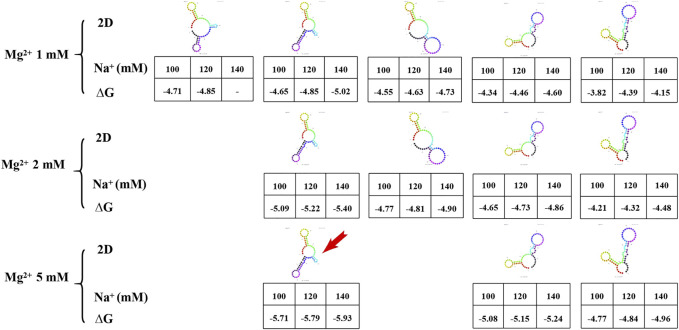
FIGURE 4.
The secondary structure and free energy (∆G) of AP273 predicted at different ion concentrations. The colour figures: secondary structures of AP273. Table: Na+ concentration in the first row, ∆G value in the second row. Red arrow: the secondary structure selected for the prediction of tertiary structure.

