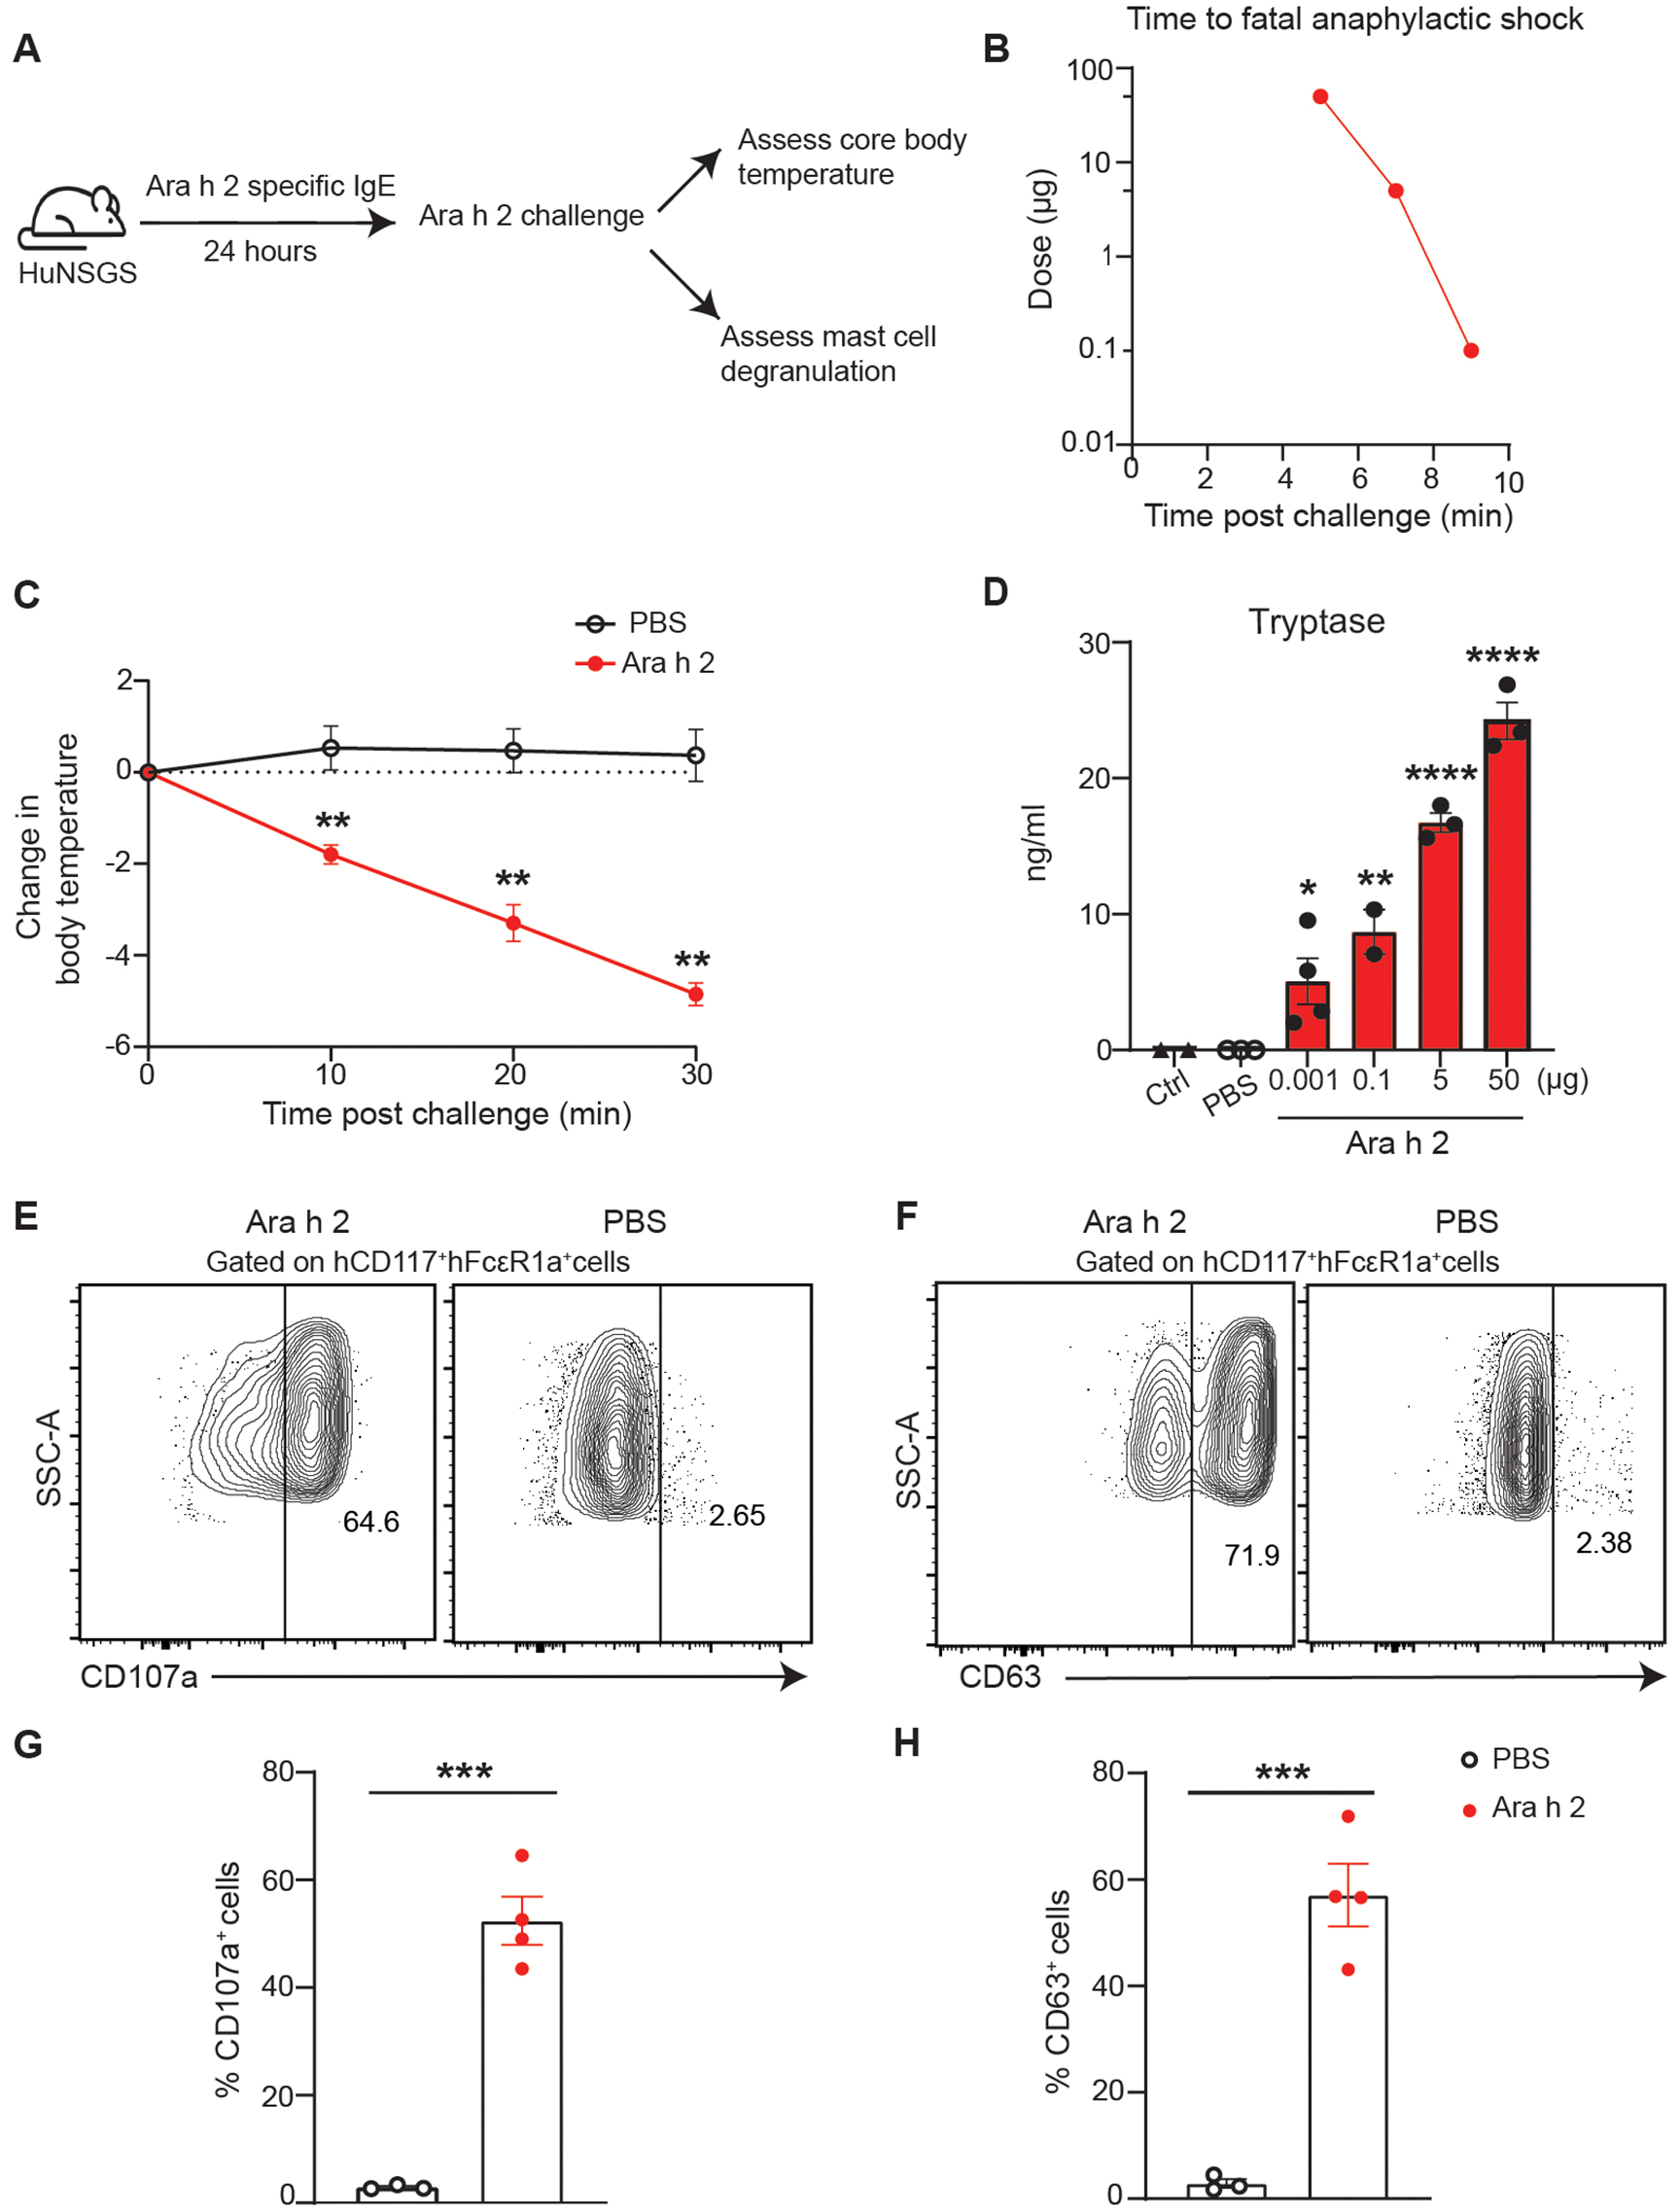
Fig. 3: HuNSGS mouse model predicts mast-cell mediated PSA to Ara h 2 allergen.

(A) Schematic illustration of PSA in huNSGS mice. Mice were sensitized with a cocktail of six Ara h 2 specific IgE mAbs (100 μg) and challenged intravenously 24 hours later with Ara h 2 at (50, 5,1, or 0.001 μg). (B) Time to fatal anaphylactic shock following challenge is Ara h 2 allergen-dose dependent (n = 3) (C) Change of core body temperature measured post Ara h 2 (1 ng) challenge. Data represent mean ±SEM, (n = 3–4). (D) Scatter plot of tryptase serum levels in huNSGS mice challenged with the indicated doses of Ara h 2 (n = 3–4). (E-H) Analysis of mast cell degranulation markers in huNSGS mice challenged with (1ng) of Ara h 2. (E,F) Representative contour plot of surface expression levels of splenic mast cells degranulation markers CD107a (E), and CD63 (F). (G,H) Scatter plot of the percentage of CD107a (G) and CD63 (H) positive cells (n = 3–4). One way ANOVA followed by unpaired t-test was used to compare means in (C), and (D); an unpaired Mann Whitney test was used to compare means in (G), and (H). ****P <0.0001, ***P <0.001, **P <0.01, *P <0.05. Ctrl indicates non-engrafted NSGS control mice.
