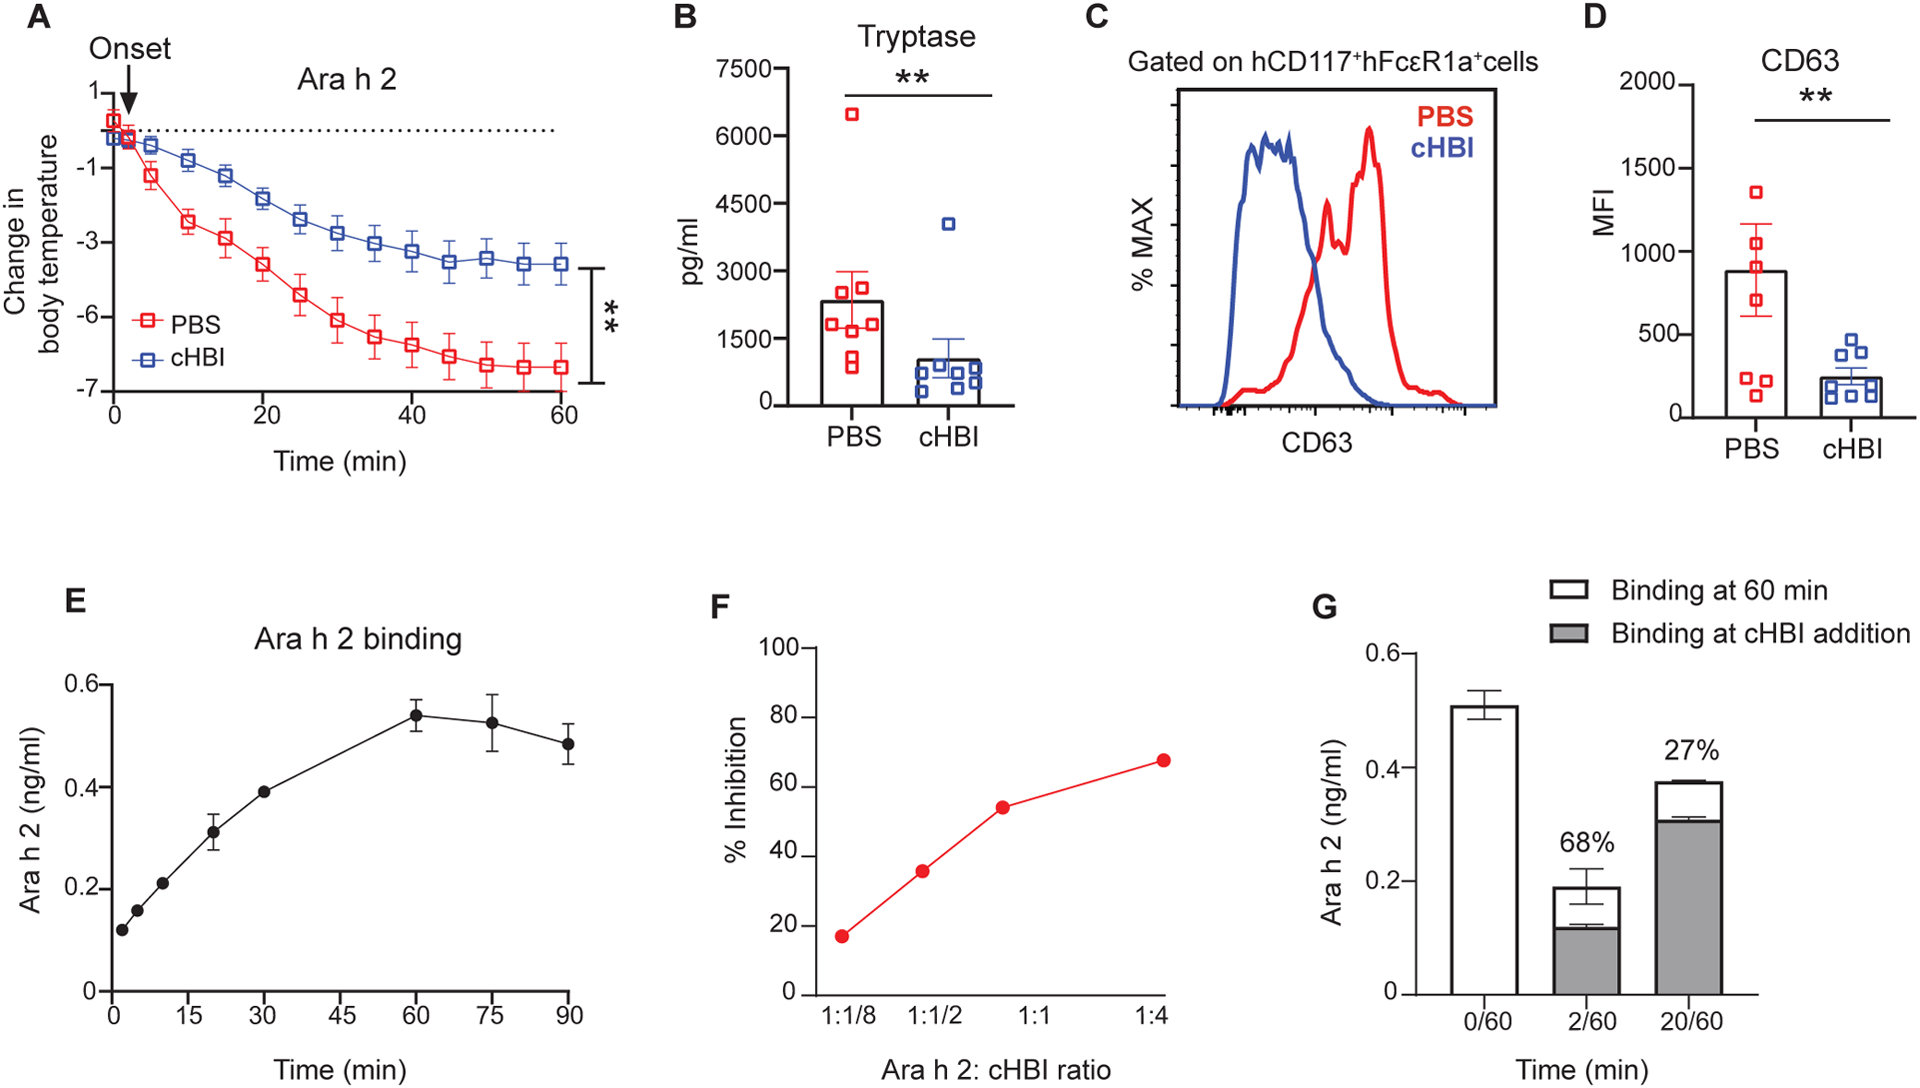
Fig. 7: cHBI attenuates symptoms when administered after the onset of anaphylaxis.

(A) HuNSGS mice were sensitized with a cocktail of six Ara h 2 specific IgE (1 μg), after 24 hours mice were challenged intravenously with Ara h 2 (1 ng). cHBI (20 nmol) or PBS was administrated two minutes post allergen challenge after the initial drop in core body temperature. (A) Change in core body temperature in PBS-treated mice and cHBI-treated mice. Data represent mean ±SEM (n=8). Data are pooled from two independent experiments. (B) Scatter plot of serum tryptase levels in PBS-treated mice and cHBI-treated mice. (C) Representative flow plot showing surface expression levels of degranulation marker CD63 on peritoneal mast cells. (D) Scatter plot of the median fluorescence intensity (MFI) of CD63 positive cells (n = 8). Data are pooled from two independent experiments. Arrow in (A) indicates the time of cHBI onset of anaphylaxis administration. (E) Time-dependent binding of Ara h 2 using ELISA with 38B7 as the capture IgE and 16A8 as the detection antibody. (F) Percent inhibition of Ara h 2 bound in the ELISA described in (E) when cHBI is added two minutes after Ara h 2. (G) Attenuation of Ara h 2 binding by cHBI assessed at 60 minutes when cHBI is added at 2 minutes (2/60) or 20 minutes (20/60). Gray bars represent Ara h 2 concentration at time of cHBI addition. Stacked white bars represent concentration of Ara h 2 after 60 minutes. Data represent mean ±SEM of technical replicates, and are representative of three independent experiments. One way ANOVA with Tukey post hoc test was used to compare means in (A). One way ANOVA followed by unpaired t-test was used to compare means in (B), and (D). **P <0.01.
