
FIGURE 4.
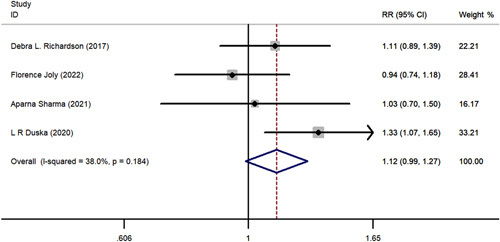
The forest plot comparing of disease control rate between chemotherapy with or without pazopanib. RR indicates risk ratio.
Official websites use .gov
A
.gov website belongs to an official
government organization in the United States.
Secure .gov websites use HTTPS
A lock (
) or https:// means you've safely
connected to the .gov website. Share sensitive
information only on official, secure websites.
The forest plot comparing of disease control rate between chemotherapy with or without pazopanib. RR indicates risk ratio.