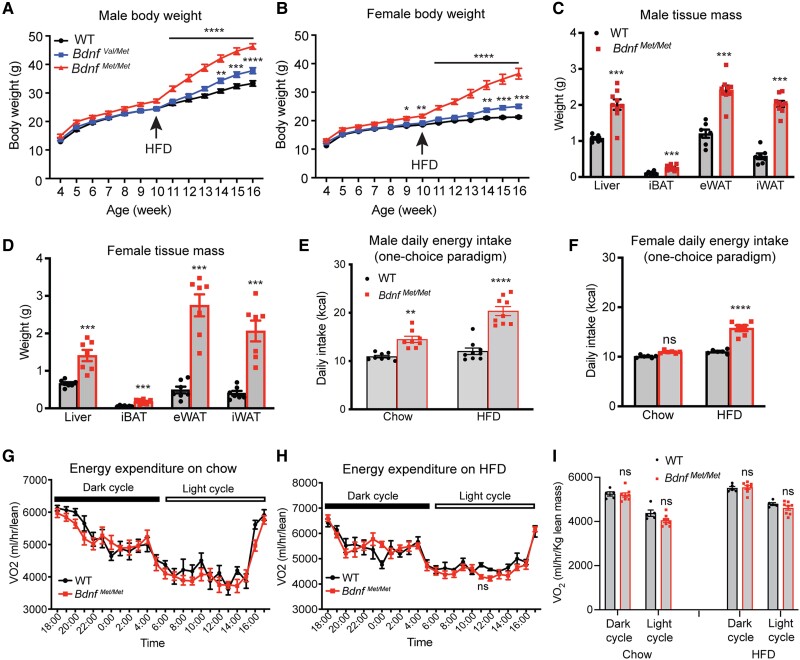
Figure 1.
BdnfMet/met mice develop hyperphagic obesity on a high-fat diet (HFD). A, Body weight of male wild-type (WT), BdnfVal/Met, and BdnfMet/Met mice. n = 10-15 mice per genotype; 2-way analysis of variance (ANOVA) (mixed-effects analysis) with Bonferroni multiple comparison test: P less than .0001 for genotype; **P less than .01, ***P less than .001, and ****P less than .0001 when compared with WT mice. B, Body weight of female WT, BdnfVal/Met, and BdnfMet/Met mice. n = 11-15 mice per genotype; 2-way ANOVA (mixed-effects analysis) with Bonferroni multiple comparison test: P less than .0001 for genotype; *P less than .05, **P less than .01, ***P less than .001, and ****P less than .0001 when compared with WT mice. C and D, Weight of individual tissues dissected from male and female mice after 6 weeks of HFD feeding. n = 10-15 mice per group; ***P less than .001 by unpaired t test. E, Daily calorie intake of male mice fed either chow or HFD. Measurements were taken during periods of chow and HFD feeding. n = 8-9 mice per group; 2-way ANOVA with Bonferroni multiple comparison test: P less than .0001 for both genotype and diet and P equal to .0017 for interaction between diet and genotype; **P less than .01 and ****P less than .0001. F, Daily calorie intake of female mice fed either chow or HFD. Measurements were taken during periods of chow and HFD feeding. n = 6 mice per group; 2-way ANOVA with Bonferroni multiple comparison test: P less than .0001 for both genotype and diet and P less than .0001 for interaction between diet and genotype; ns, no significance and ****P less than .0001. G, Oxygen consumption (VO2) of male mice on chow. n = 5-8 mice per group; 2-way repeated measures (RM) ANOVA: P equal to .3397 for genotype. H, VO2 of male mice on HFD. n = 5-8 mice per group; 2-way RM ANOVA: P equal to .5678 for genotype. I, VO2 of male mice fed either chow or HFD during light and dark cycle. n = 6-8 mice per group; 2-way RM ANOVA with Sidak multiple comparison test: ns, no significance. All data are shown as mean ± SEM.

