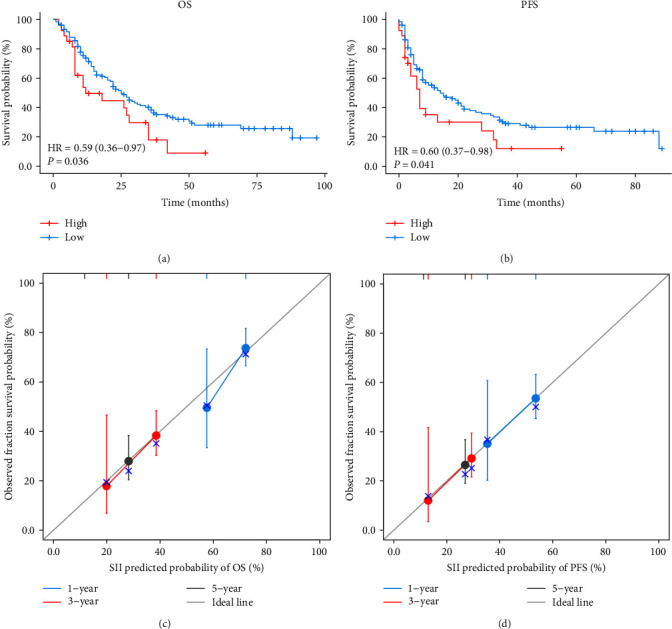
Figure 1.

Survival analysis in patients with esophageal cancer receiving concurrent chemoradiotherapy. (a) Kaplan–Meier survival curve for OS according SII. (b) Kaplan–Meier survival curve for PFS according SII. (c) 1-, 3-, and 5-year calibration curves of SII in OS. (d) 1-, 3-, and 5-year calibration curves of SII in PFS. OS, overall survival; PFS, progression-free survival; SII, systemic immune-inflammation index; HR, hazard ratio.
