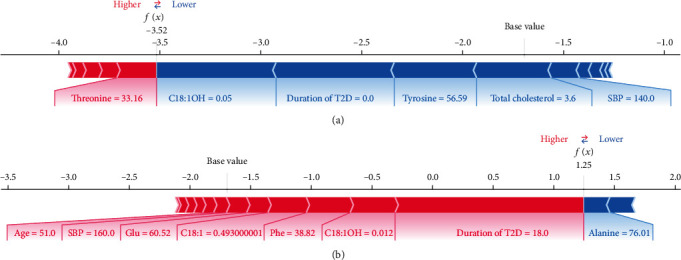
Figure 5.

Two examples of the local explanation of the predictions using the Shapley Additive exPlanation (SHAP) values. (a) Predicted type 2 diabetes patient without diabetic retinopathy. (b) Predicted type 2 diabetes patient with diabetic retinopathy. Factors that push the predicted score higher compared to the base value (mean prediction) are coloured red, and those pushing lower the prediction are shown in blue. C18 : 1OH: 3-hydroxy-octadecylcarnitine; T2D: type 2 diabetes; SBP: systolic blood pressure; Glu: glutamate; C18 : 1: octacarbonylcarnitine; Phe: phenylalanine; C18 : 2: octadecadienylcarnitine.
