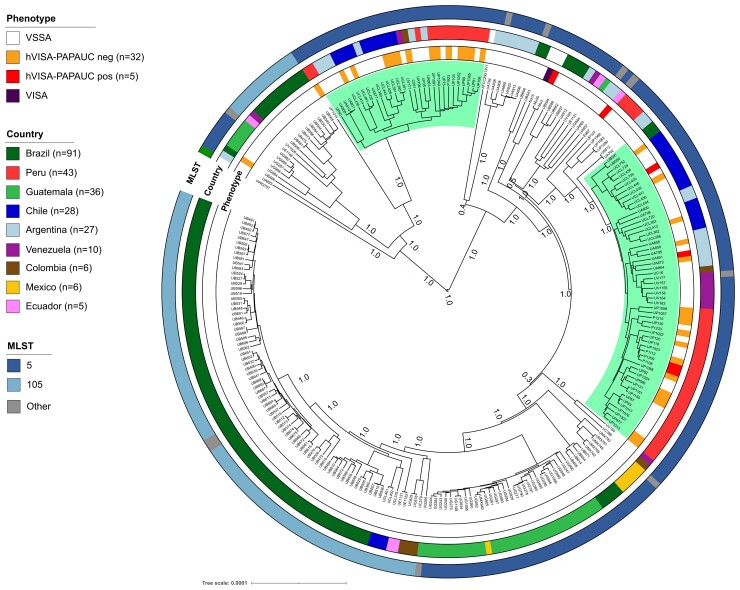
Figure 1.
Phylogeny of CC5 MRSA isolates. Bayesian phylogenomic tree using the core genome of 257 Clonal complex 5 (CC5) genomes. Highlighted branches represent two groups of hVISA isolates. Annotation rings (from inner to outer) show the vancomycin phenotype, the country and the ST of the isolate. Bootstrap values are showed in each branch. This figure appears in colour in the online version of JAC and in black and white in the print version of JAC.

