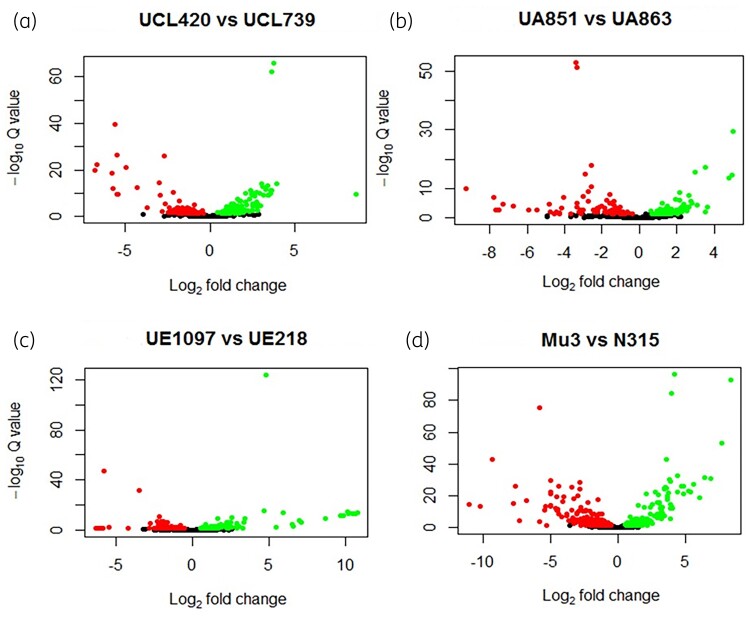
Figure 2.
Volcano plot of DEG between hVISA versus VSSA. The differential expressed genes (P value < 0.05) are represented for each pair of transcriptomes comparison (hVISA versus VSSA). Dots indicate genes downregulated or upregulated in hVISA when compared with VSSA. (a) UCL420 versus UCL739 pair showed a total of 283 DEG, 166 genes were downregulated and 117 upregulated in UCL420 (hVISA). (b) UA851 versus UA863 showed a total of 189 DEG; 88 genes were downregulated and 101 upregulated in UCL851 (hVISA). (c) UE1097 versus UE218 showed a total of 205 DEG; 91 genes were downregulated and 114 upregulated in UE1097 (hVISA). (d) Mu3 versus N315 showed a total of 502 DEG; 300 genes were downregulated and 202 upregulated genes in Mu3 (hVISA). This figure appears in colour in the online version of JAC and in black and white in the print version of JAC.

