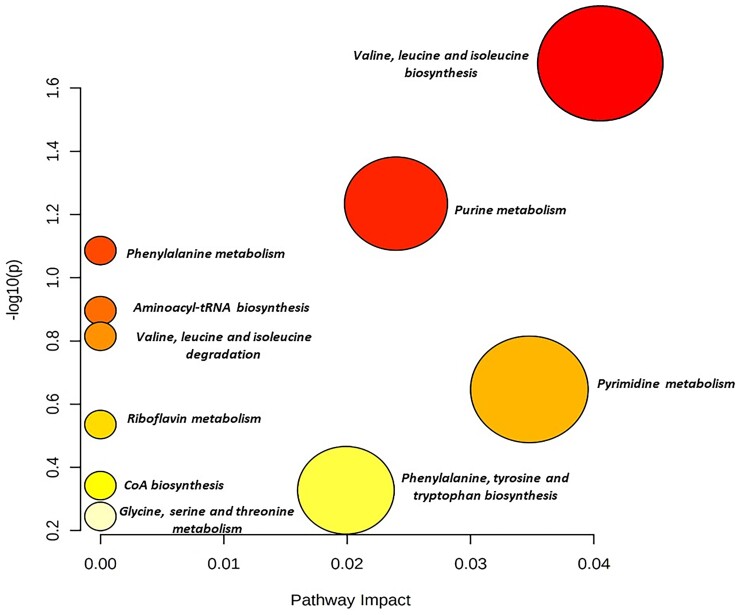
Figure 4.
Metabolite set enrichment analysis. Metabolic pathways are represented as circles according to the scores obtained in the enrichment (y-axis) and topology (pathway impact, x-axis) analyses using MetaboAnalyst v.5.0. Darker circles indicate the most significant metabolite changes in each biochemical pathway. The size of the circle corresponds to the pathway impact score and correlates with the metabolites involved. Pathways were annotated by numbering when P values calculated from enrichment analysis were 0.05. This figure appears in colour in the online version of JAC and in black and white in the print version of JAC.

