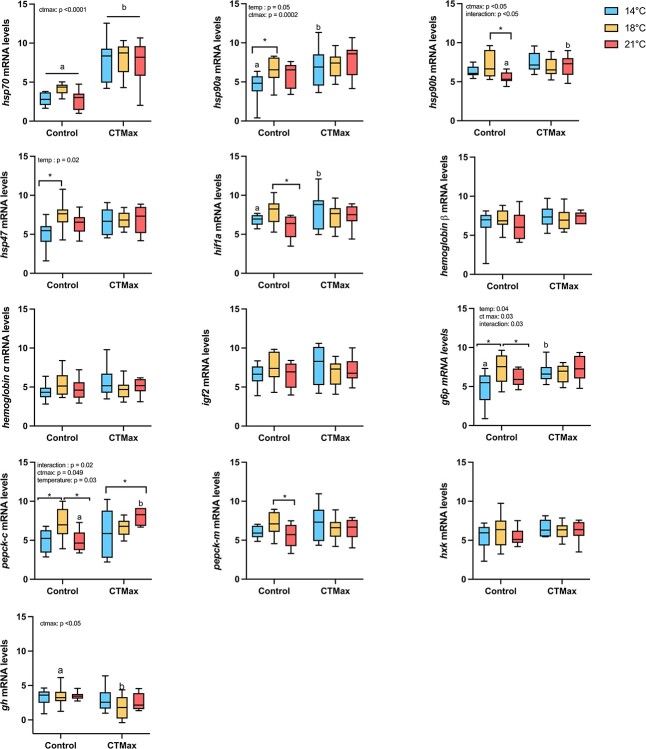
Figure 7.
White sturgeon (A. transmontanus) larval mRNA levels for all genes measured after acclimation to three different temperatures (14°C – blue, 18°C – yellow and 21°C—pink) at control and after CTmax. Significant differences between acclimation temperatures at control or after CTmax are denoted by an asterisk. Significant differences between control and CTmax measurements within an acclimation temperature are denoted by letters. Significant two-way ANOVA effects are listed on the top of each individual gene panel.

