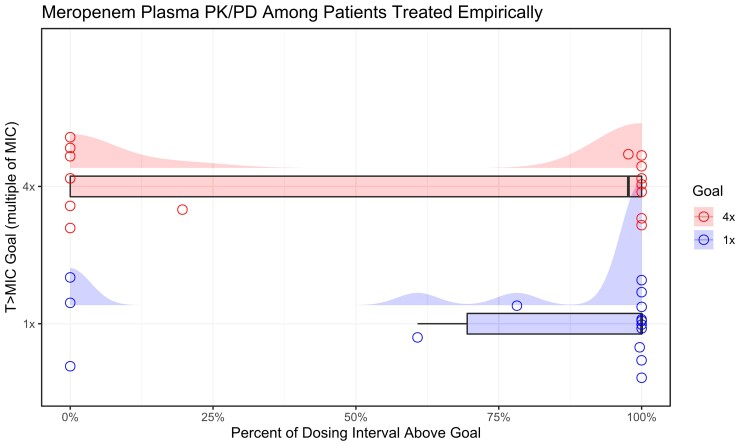
Figure 1.
Individual meropenem plasma PK/PD attainment among patients treated for HAP. PK/PD target attainment stratified by target (blue = T>1×MIC, red = T>4×MIC) among patients treated empirically. Individual observations (open circles) are jittered to increase visual clarity where values overlap. The distribution of observed PK/PD ratios is shown in box plots, with overlaid density (half-eye) plots demonstrating the range and density of PK/PD ratios in the sample.

