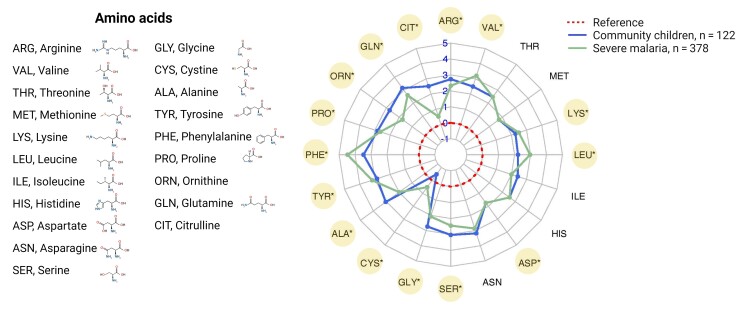
Figure 3.
Radar plot showing global changes in amino acid concentrations in severe malaria. Amino acid concentrations were normalized to the median reference provided by the performing laboratory. Each concentric line from the center representing a log2 fold change in amino acid concentrations. The radar plot depicts global changes in patterns of amino acids in children with severe malaria compared to the community children. Amino acid concentrations that were different between children with severe malaria and the community children after adjusting for multiple comparisons are depicted with an * and highlighted in yellow. Differences were compared using the Wilcoxon rank-sum test with Bonferroni correction. Created with BioRender.com.

