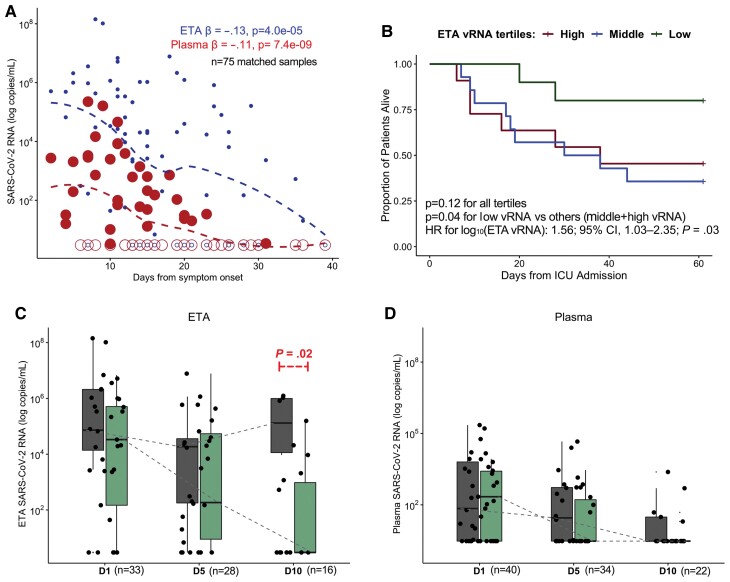
Figure 2.
Plasma and lower respiratory tract vRNA levels exhibit similar temporal decline although persistently elevated vRNA levels in lower respiratory tract samples are associated with increased mortality. A, Scatterplot of reported days from COVID-19 symptom onset and viral RNA (vRNA) levels (log10 transformed) in endotracheal aspirate (small circles) and plasma (large circles) samples. The β coefficients and corresponding P values of mixed linear regression models of log10-transformed vRNA levels with random patient intercepts and adjustment for time of sample acquisition from symptom onset are shown, with displayed dashed lines from locally weighted scatterplot smoothing. Samples with undetectable vRNA levels are depicted with empty circles. B, Kaplan-Meier curves of 60-day survival by ETA vRNA tertiles among patient samples obtained within the first 6 days of ICU admission: low vRNA tertile < 4844 (n = 10); middle 4482–490 922 (n = 14); high > 490 922 copies/mL (n = 11). C and D, Box and whisker plots showing ETA and plasma vRNA levels, stratified by sampling day and comparing nonsurvivors (dark gray) and survivors (light green). Boxes represent the interquartile ranges, horizontal lines represent the medians, and vertical lines extend from minimum to maximum values. Dashed lines connect the median values for each group (survivors vs nonsurvivors) at each sampling day to allow for visual appreciation of longitudinal trends in vRNA levels. Statistical comparisons for differences in trajectories were performed with mixed linear regression models with random patient intercepts and interaction terms for survivorship sampling day. Abbreviations: CI, confidence interval; COVID-19, coronavirus disease 2019; D1, enrollment day 1; D5, postenrollment day 5; D10, postenrollment day 10; ETA, endotracheal aspirate; HR, hazard ratio; SARS-CoV-2, severe acute respiratory syndrome coronavirus 2; vRNA, SARS-CoV-2 RNA.

