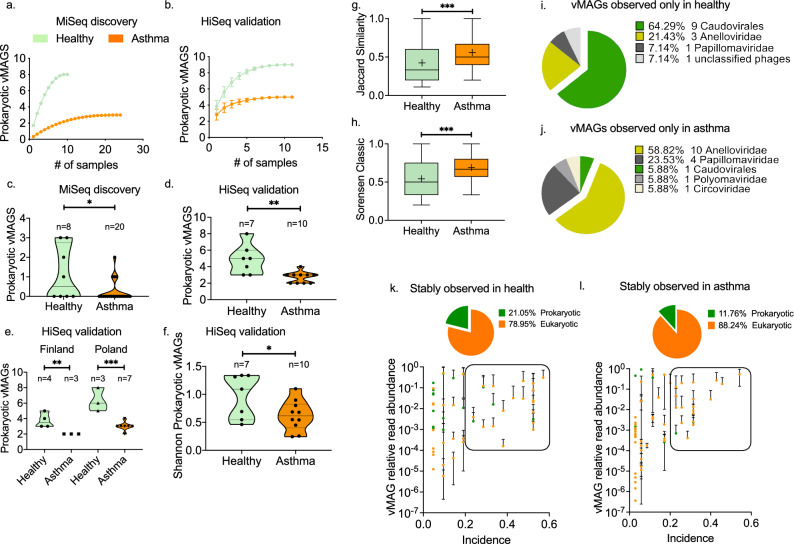
Figure 1.
Diversity of prokaryotic viruses in health and asthma. Comparison of the sample-based estimated richness of prokaryotic vMAGs in the (a) MiSeq discovery cohort (health n = 10, asthma n = 24), and (b) HiSeq validation cohort (health n = 11, asthma n = 11). The graph depicts the accumulation of bacteriophage vMAGs with increasing number of analysed specimens after randomisation without replacement. Data points depict mean values calculated after 100 repetitions with standard deviations. Scatter plots of the number of prokaryotic vMAGs observed in each sample in (c) the discovery (health n = 8, asthma n = 20), and (d) validation (health n = 7, asthma n = 10) cohorts. Median and 95%CIs are depicted. Statistical significance was tested using parametric two-tailed t test. (e) Comparison of the prokaryotic vMAG richness between healthy and asthmatic individuals in Poland (n = 4, n = 3) and Finland (n = 3, n = 7); HiSeq cohort. Median and 95%CIs are depicted. Statistical significance was tested using parametric two-tailed t test. (f) Comparison of the prokaryotic vMAG Shannon diversity between healthy (n = 7) and asthmatic (n = 10) individuals; HiSeq cohort. Median and 95%CIs are depicted. Statistical significance was tested using parametric two-tailed t test. (g) Jaccard and (h) Sorensen indexes of the prokaryotic vMAG beta diversity within health (n = 11) and asthma (n = 11): Floating bars depict range, mean (cross) and median of the calculate between the samples within each group (n = 11 × 11); HiSeq cohort. Statistical significance was tested using nonparametric Mann Whitney test. (i) Compositional pie charts of vMAGs observed exclusively in (i) healthy children or (j) in children with asthma. Scatter plots of vMAG incidence and vMAG mean relative read abundance in (k) health, and (l) asthma: We defined stably observed viruses based on their average sequencing read abundance and incidence; Data points within the frame represent stably observed vMAGs. The proportion of prokaryotic and eukaryotic vMAGs in this subset is presented as pie charts. Colour-coding: Orange; asthma Green; health. Significance tests: *p < 0.05, **p < 0.001, ***p < 0.0001, ****p < 0.00001.

