Figure 2.
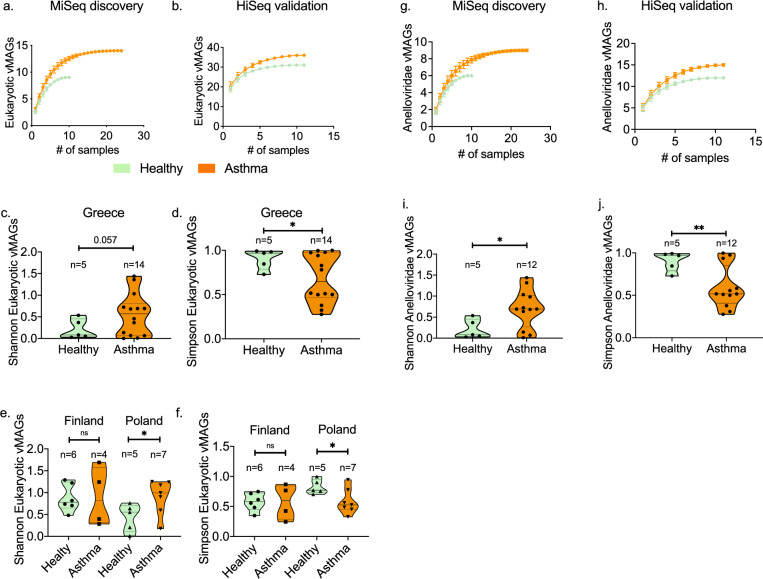
Diversity of eukaryotic viruses in health and asthma. Comparison of the sample-based estimated number of eukaryotic vMAGs in the (a) MiSeq discovery cohort (health n = 10, asthma n = 24), and (b) HiSeq validation cohort (health n = 11, asthma n = 11). The graph depicts the accumulation of eukaryotic vMAGs with increasing number of analysed specimens after randomisation without replacement. Data points depict mean values calculated after 100 repetitions with standard deviations. Comparison of the alpha diversity Shannon and Simpson indexes between health and asthma in the MiSeq discovery; (c) and (d), and HiSeq validation; (e) and (f), cohorts. (MiSeq: health n = 5 & asthma n = 14) (HiSeq: Finland health n = 6 & asthma n = 4, Poland health n = 5 & asthma n = 7). Comparison of the sample-based estimated number of Anelloviridae vMAGs in the (g) MiSeq discovery cohort (health n = 10, asthma n = 24), and (h) HiSeq validation cohort (health n = 11, asthma n = 11). Comparison of the alpha diversity (i) Shannon, and (j) Simpson indexes between health and asthma in the MiSeq discovery (health n = 5, asthma n = 12). Median and 95%CIs are depicted. Statistical significance was tested using parametric two-tailed t tests with Welch’s correction. Significance tests: *p < 0.05, **p < 0.001, ***p < 0.0001, ****p < 0.00001.

