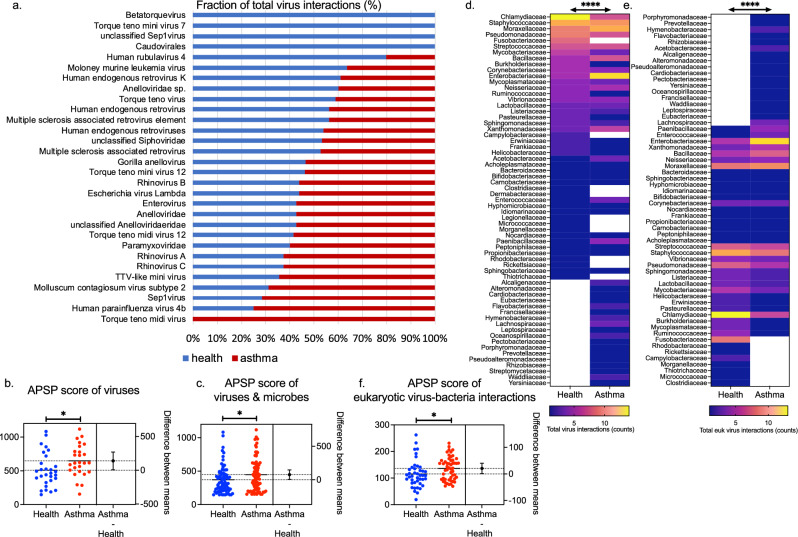
Figure 4.
Comparison of virus interactomes in health and asthma. (a) Distribution (%) of the total number of virus interactions observed in health and/or in asthma. (b) Comparison of the virus APSP scores in health and in asthma; the difference between groups means is depicted (n = 30 viruses). (c) Comparison of the commonly observed virus and bacteria (n = 77) APSP scores in health and in asthma; the difference between groups means is depicted. Heatmaps of (d) the total virus interactions, and (e) the total eukaryotic virus interactions of each bacterial family (n = 63 and n = 60 families, respectively) within the virus interactomes in health and asthma. (f) Comparison of the mean APSP score of the eukaryotic virus-bacteria interactions (edges) for each bacterial family (n = 60) in health versus in asthma; the difference between groups means is depicted. Two-way ANOVA significance tests: *p < 0.05, **p < 0.001, ***p < 0.0001, ****p < 0.00001.

