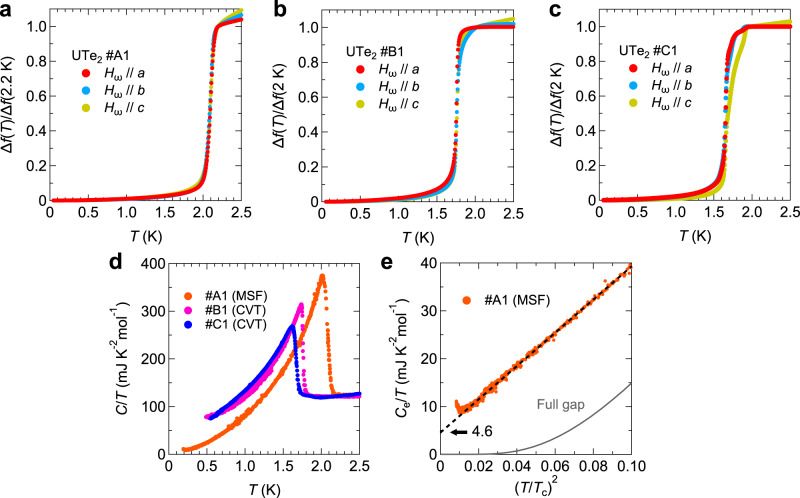
Fig. 2. Superconducting transitions in UTe2.
a-c, Overall temperature dependence of the frequency shift Δf in UTe2 for crystal #A1 (a), #B1 (b), and #C1 (c). The data of #A1 (#B1 and #C1) are normalized by the value at 2.2 K (2 K). d, Temperature dependence of the specific heat C divided by T in crystals #A1, #B1, and #C1 measured at zero field. e, Enlarged views of the electronic specific heat Ce/T in crystal #A1 at low temperatures as a function of . The black broken line represents the linear fitting of the data. The gray solid line is the theoretical curve expected for a full gap structure with the gap size Δ = 2.2kBTc, which shows a similar size of the specific heat jump with the experiments.

