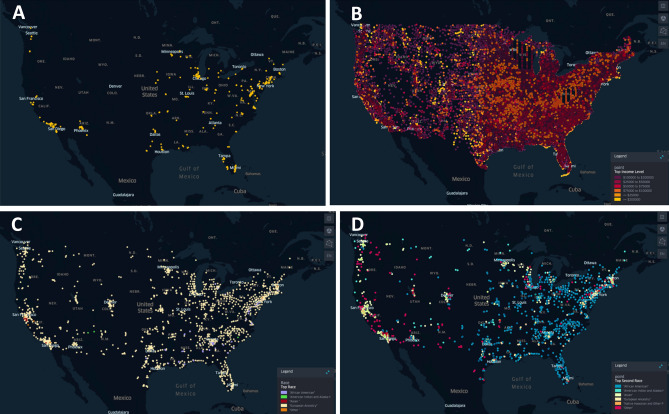
Figure 2.
Institutions which are currently offer PSMA scans are predominantly located in the Northeast, Midwest, and the west coast (A). These institutions overlapped with zip codes where the residents belonged to a wealthier demographic population (AGI > $100,000) based on data extracted from the 2018 IRS tax returns (B) and had an EA majority based on the 2020 Census Data (C). When evaluating the second most common ethnic group in these locations (D), the east coast had predominantly AA individuals while the West coast was mostly Other and Asians. Geospatial maps created using open source software kepler.gl.

