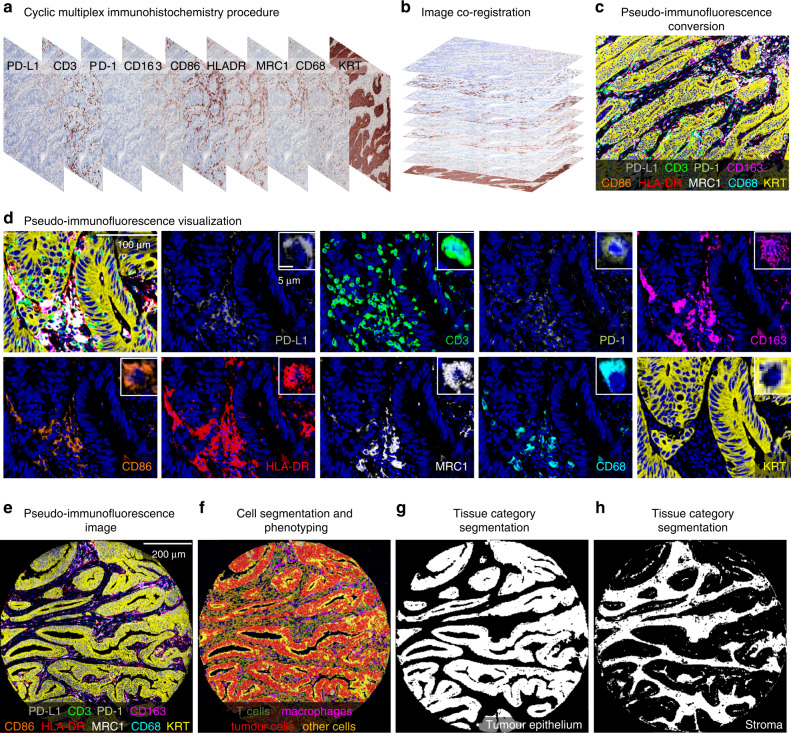
Fig. 1. Multiplex immunohistochemistry panel and image analysis.
a Digitised multiplex immunohistochemistry image from each staining cycle for one tumour. b, c Image co-registration based on aligning the hematoxylin layers to merge individual images into one 10-channel pseudo-immunofluorescence image. d example images showing the expression patterns of each marker merged and separately. e−h pseudo-immunofluorescence image (e), machine learning-based cell segmentation and phenotyping into T cells, macrophages, tumour cells, and other cells (f), and mask images of the categorisation of tissue into tumour epithelium and stroma (g, h).

