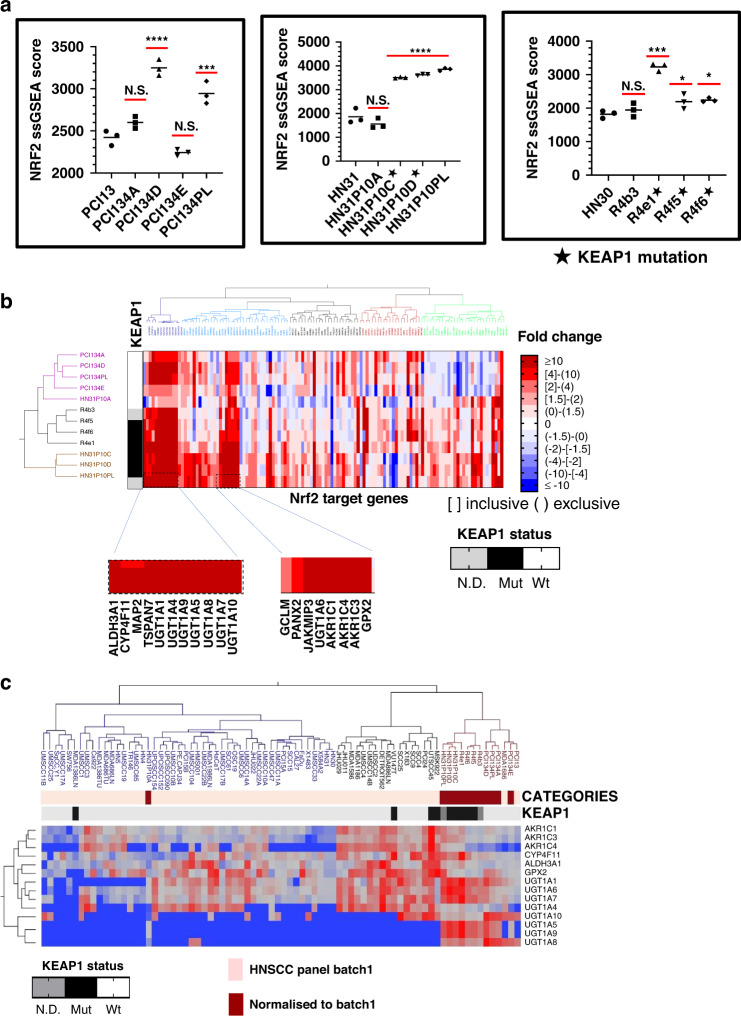
Fig. 2. Activation of Nrf2 in CDDP-resistant clones.
a Overall, 8/12 individual clones demonstrated significant increases in the Nrf2 ssGSEA score compared to the parental cell lines. ****AdjP<0.0001, ***AdjP<0.001, and *AdjP<0.05 by Tukey ‘s Honest Significant Difference test. b Ward’s hierarchical clustering of individual CDDP-resistant clones by fold changes in RNA expression of Nrf2 downstream target genes used to calculate the Nrf2 ssGSEA scores above. The KEAP1 mutational status of clones is annotated vertically and Nrf2 target genes with the most consistent and robust upregulation are annotated horizontally across the bottom. c RNA expression of the most robustly upregulated Nrf2 target genes from (b) in a large panel of established HNSCC cell lines (i.e., batch 1), along with normalised imputed values from the CDDP-resistant clones were used for two-way Ward’s clustering to contextualise the degree of overexpression relative to drug-naive cell lines with or without existing KEAP1 mutations. Fold change in CDDP-resistant clones relative to their parental lines (also appearing in the batch 1 analysis) were used to impute normalised values for clustering and comparison.

