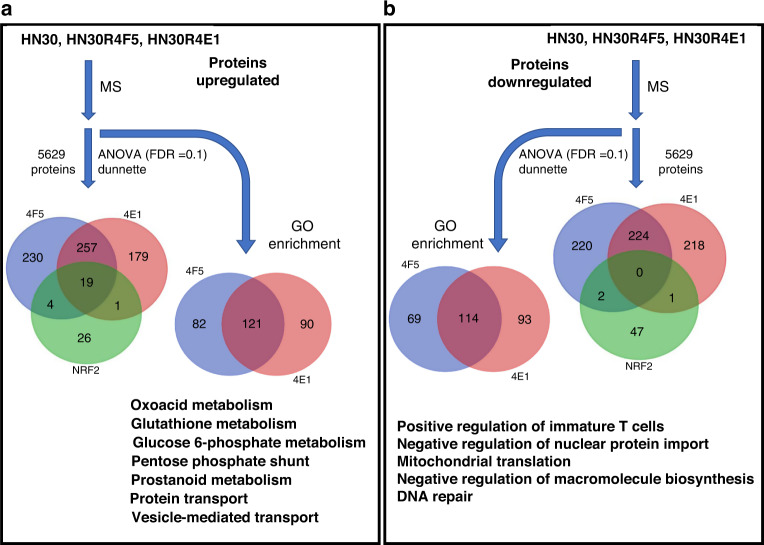
Fig. 3. Protein validation of Nrf2 activation and metabolic reprogramming.
Venn diagram of proteins significantly upregulated (a) or downregulated (b) in CDDP-resistant clones HN30R4F5 or HN30R4E1 relative to parental HN30. Within each panel, the Venn diagram below the double arrows corresponds to the number of proteins altered, with the bottom circle (green) demonstrating overlap among 50 Nrf2 downstream targets that happen to be detected by mass spectrometry. Venn diagrams beneath the curved arrow correspond to the number of GO pathways enriched among proteins altered in each clone. Among proteins contained within the Nrf2 signature, 19 were upregulated in both clones and none were downregulated in both clones. GO analysis revealed multiple significantly enriched and depleted pathways.

