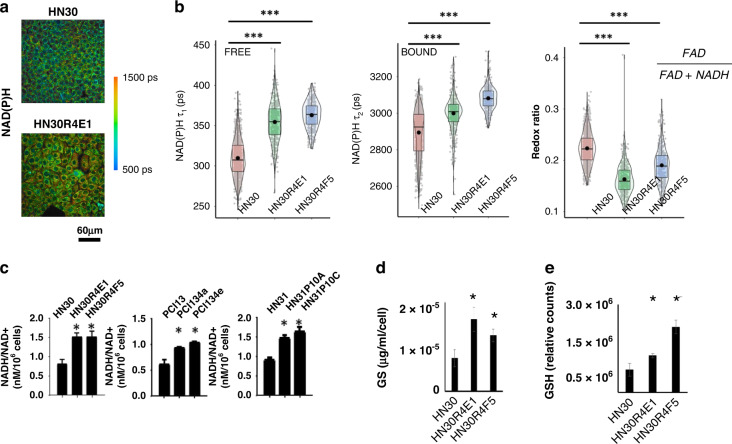
Fig. 4. CDDP-resistant cells have an enhanced reductive potential.
CDDP-resistant cells demonstrated increased fluorescence lifetime of NAD(P)H at an individual cell level (scale bar = 60 μm) (a) which is due to increased lifetimes of both free and protein-bound (or adjacent) NAD(P)H with a concomitant reduction in the REDOX ratio of FAD/(FAD + NAD(P)H) (b). Biochemical measurements confirm a significant increase in the ratio of NADH/NAD + in all three cell lineages under normal growth conditions. Total glutathione (GS) measured biochemically and normalised to cell number (d) is significantly higher in CDDP-resistant clones as is reduced glutathione (GSH) measured using fluorescence (e). (*P < 0.05; **P < 0.01; ***P < 0.001). Data for (c–e) are presented as means + /− standard error of the mean.

