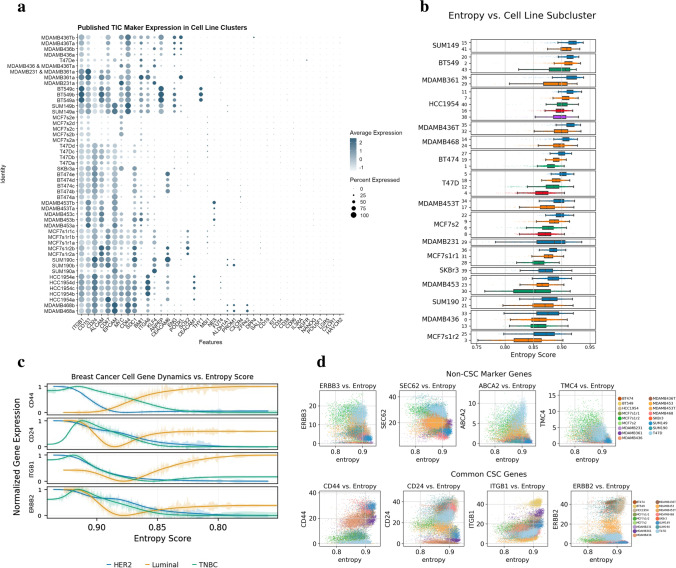
Fig. 3.
Investigating markers of Tumor Initiating Cells. a Dot plot visualizing expression of stemness-related genes identified through a literature review. b Box plot of cell lines and subpopulations sorted by mean entropy score. c Line plot comparing TIC marker expression by entropy score between major disease subtypes, where Luminal A and Luminal B samples were merged to a combined Luminal subset. d Scatter plots of key genes identified to have significant positive and negative correlation to entropy throughout the global dataset

