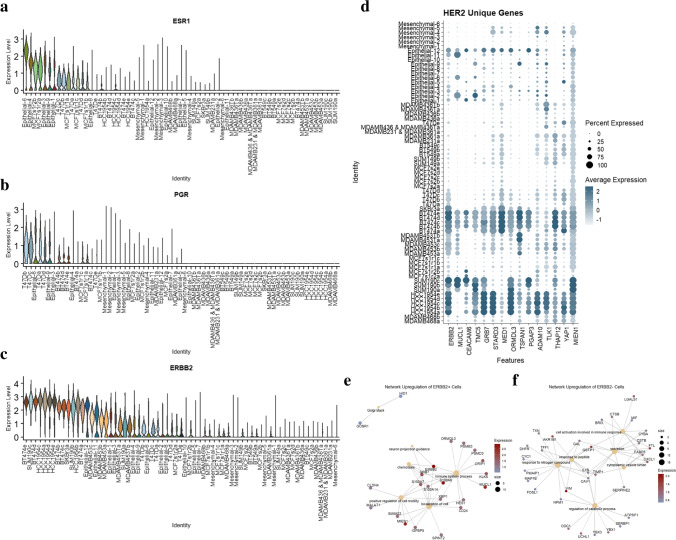
Fig. 6.
Higher resolution subtyping of breast cancer cell lines and HER2 characterization. a Violin plot outlining expression of hormone receptor gene ESR1, with high expression observed in epithelial primary tumor cell clusters. b Violin plots outlining expression of hormone receptor gene PGR. c Violin plot outlining expression of receptor genes ERBB2. d DotPlot outlining expression of genes identified as differentially expressed by HER2 + cell samples. e Network analysis of genes differentially expressed by global ERBB2 + cells. f Network analysis of genes differentially expressed by global ERBB2- cells

