
Fig. 4.
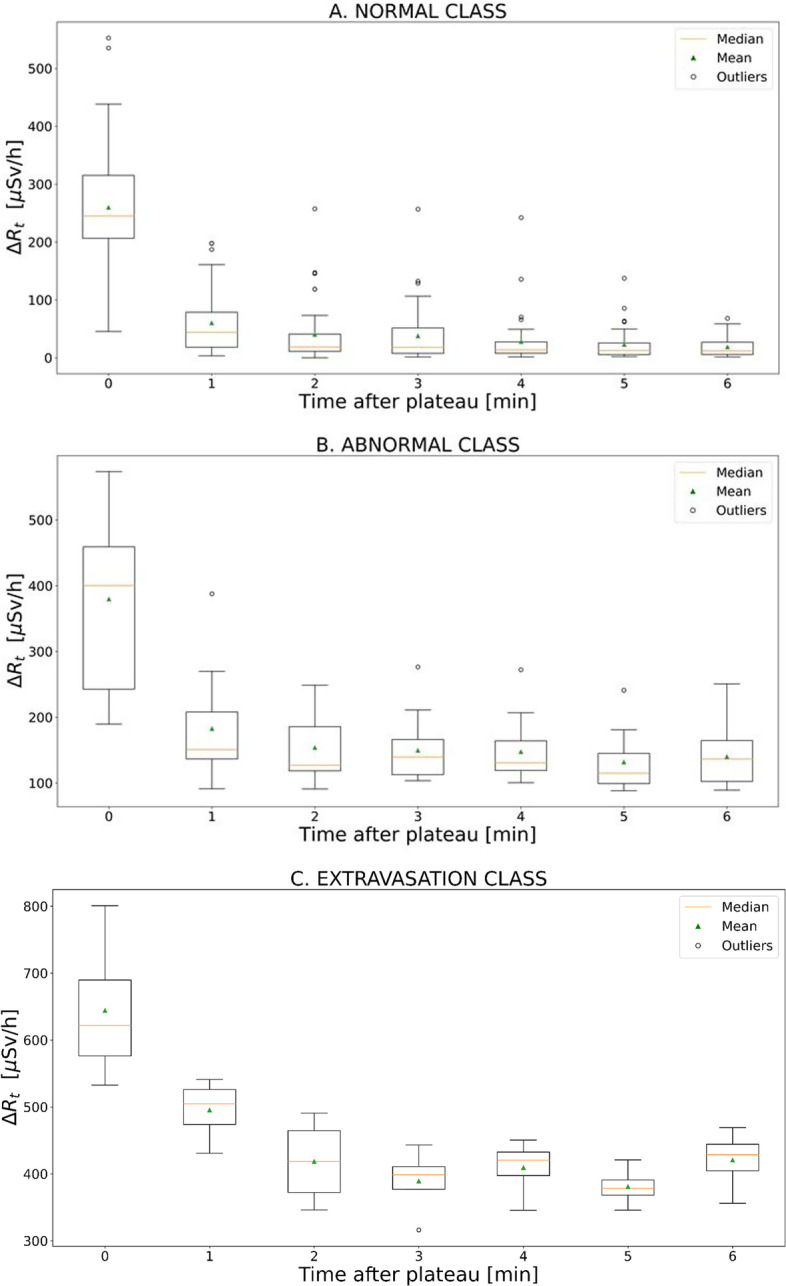
The figure shows the trend of ΔRt with time. A Box plot related to the normal administration cases. B Box plot related to administration with abnormal behaviour. C Box plot related to extravasation cases
Official websites use .gov
A
.gov website belongs to an official
government organization in the United States.
Secure .gov websites use HTTPS
A lock (
) or https:// means you've safely
connected to the .gov website. Share sensitive
information only on official, secure websites.
The figure shows the trend of ΔRt with time. A Box plot related to the normal administration cases. B Box plot related to administration with abnormal behaviour. C Box plot related to extravasation cases