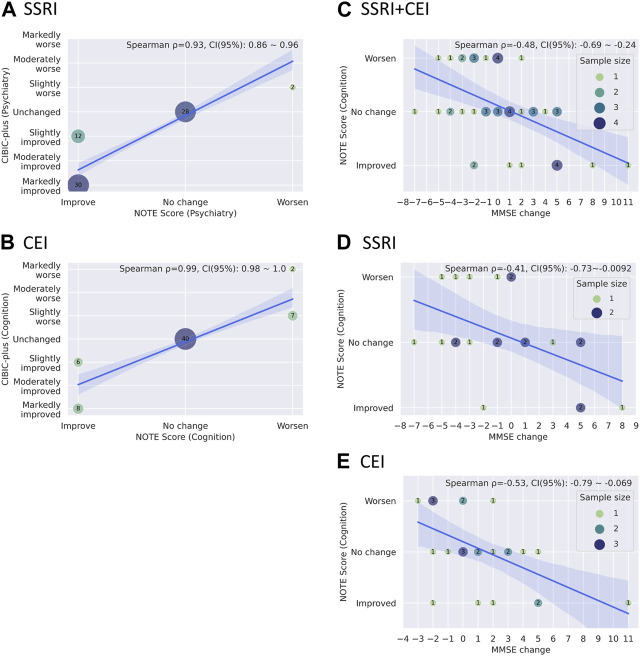
FIGURE 6.
(A, B) Bubble plots showing the relationships between CIBIC-plus and NOTE scores through drugs (A) SSRI psychiatric scores and (B) CEI cognitive scores). (C–E) Bubble plots showing the relationship between MMSE changes and cognitive NOTE scores by drugs: (C) SSRI + CEI, (D) SSRI, and (E) CEI. A solid blue line and a light blue area represent the regression line with its 95% confidence intervals. The mean coefficient, 95% confidence interval of Spearman’s rank correlation, and the legend of sample sizes (for C–E) are shown in the upper right corner of the graph. The mean coefficient and its confidence interval are estimated based on bootstrapping with 10,000 resampling iterations, using the bias-corrected and -accelerated method.

