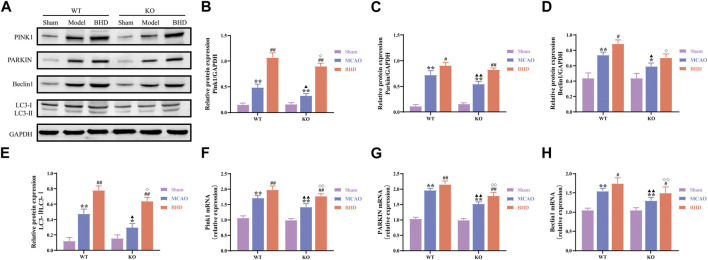
FIGURE 6.
BHD promotes mitophagy in MCAO mice through Cav-1. (A–E) Western blot and quantitative analysis of PINK1, PARKIN, Beclin1 and LC3 (n = 3). (F–H) RT‒qPCR and quantitative analysis of PINK1, PARKIN and Beclin1 (n = 6). All data are presented as the mean ± SD. **p < 0.01 vs. syngeneic sham group, # p < 0.05 and ## p < 0.01 vs syngeneic model group, ▲ p < 0.05 and ▲▲ p < 0.01 vs. WT model group, ◇ p < 0.05 and ◇◇ p < 0.01 vs. WT BHD group.

