FIGURE 6.
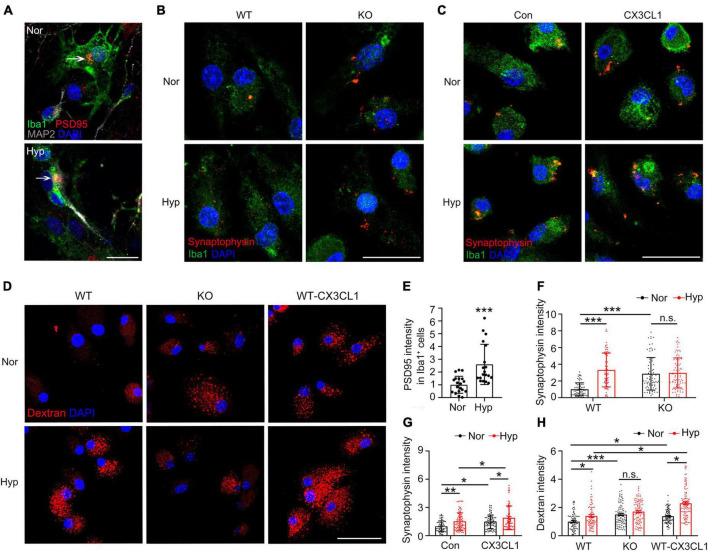
CX3CL1/CX3CR1 signal mediates hypoxia-induced phagocytosis of synapses by microglia. (A) Primary neurons co-cultured with microglia were treated with 1% O2 for 24 h. Iba1 and MAP2 with PSD95 were labeled by Immunofluorescence. (B) CX3CR1-deficient (KO) microglia were treated with 1% O2 for 24 h and incubated with dissociated synapses for 30 min. Immunofluorescence labeling of Iba1 and Synaptophysin. (C) Primary microglia were treated with 1% O2 for 20 h followed by the co-treatment of CX3CL1 for 4 h and incubated with dissociated synapses for 30 min. Immunofluorescence labeling of Iba1 and Synaptophysin. (D) WT and KO microglia were treated with 1% O2 for 24 h. WT microglia were treated with 1% O2 for 20 h followed by CX3CL1 co-treatment for 4 h. Then, the cells were incubated with TRITC-Dextran 40 kDa for 30 min, and confocal images were recorded. (E) Statistics of the total fluorescence intensity of PSD95 in Iba1+ microglia in panel (A), n = 18. (F) Statistics of the total fluorescence intensity of Synaptophysin in Iba1+ microglia in panel (B), n = 80. (G) Statistics of the total fluorescence intensity of Synaptophysin in Iba1+ microglia in panel (C), n = 55–78. (H) Statistics of the total fluorescence intensity of TRITC-Dextran in single cells in panel (D), n = 85–100. Scale bar = 20 μm, *p < 0.05, **p < 0.01, ***p < 0.001, and n.s. indicates no statistical difference.

