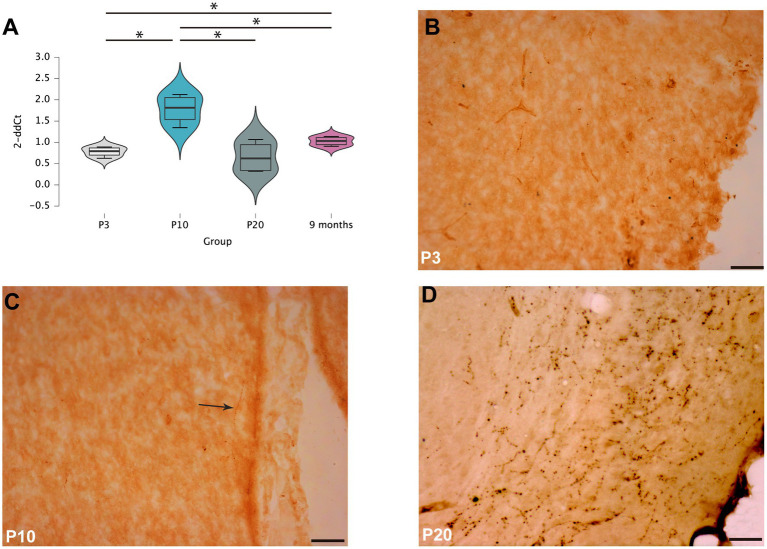
Figure 1.
RXFP3 expression and RLN3 distribution in the septal area of postnatal rats (A). RT-PCR analysis of RXFP3 mRNA levels in the septal area of P3, P10, P20 and 9 month-old rats revealed a peak at P10 and a normalization to adult concentrations by P20. Data are presented as mean ± SEM and were analyzed using one-way ANOVA followed by the LSD-text (*p < 0.05, **p < 0.01, ***p < 0.005) (B–D). Immunohistochemistry for RLN3 revealed a few fibers at P3 (B), dispersed RLN3 labeling in the septal area of P10 rats (C), and dense RLN3 fibers in the horizontal diagonal band at P20 (D). In (C), the arrow highlights a RLN3 fiber. Calibration bar, 50 μm.

