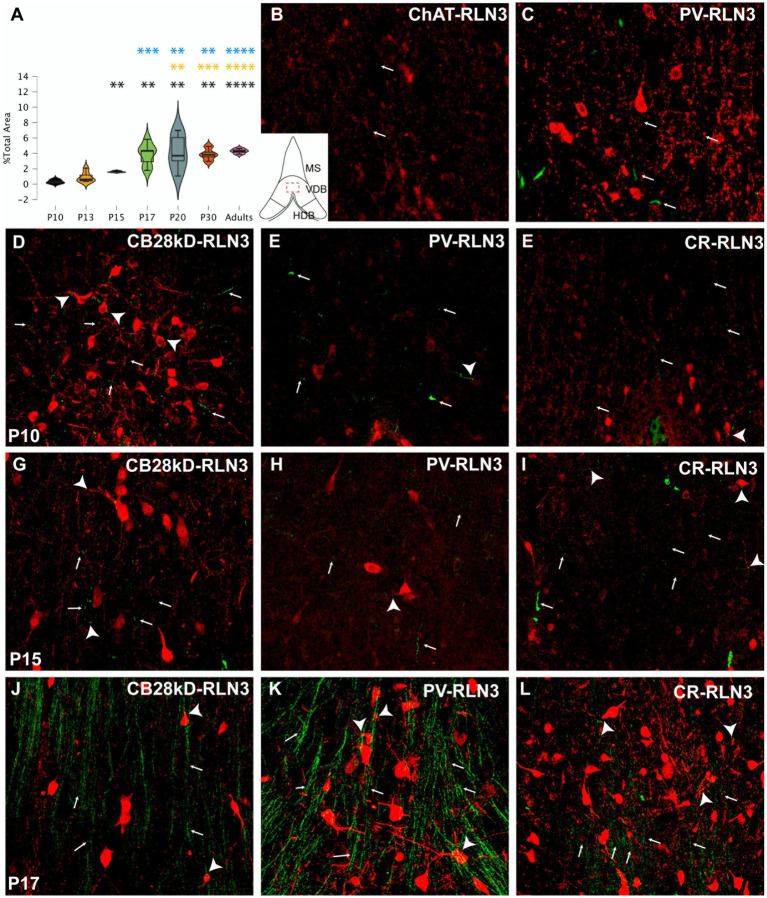
Figure 3.
Development of the RLN3 innervation of the VDB (A). Violin plots of the RLN3 fiber density during postnatal development from P10 to P20 and in adult rats (B–L). Maximal projections of a total stack of 5 μm images displaying double-labeling of calcium binding proteins or ChAT (red) and RLN3 (green) (B,C). Double-labeling at P3 for ChAT + RLN3 (B) or PV + RLN3 (C). (D–F) double-labeling at P10 for CB28kD + RLN3 (D), PV + RLN3 (E) and CR + RLN3 (F). (G–I) double-labeling at P15 for CB28kD + RLN3 (G), PV + RLN3 (H) and CR + RLN3 (I). (J–L) double-labeling at P17 for CB28kD + RLN3 (J), PV + RLN3 (K) and CR + RLN3 (L). An increased density of RLN3 fibers occurred between P15 (G–I) and P17 (J–L). Arrows point at RLN3 fibers, arrowheads point at putative contacts because of a close apposition between a positive RLN3 fiber and an IF structure. Calibration bar B-L, 50 μm. Colored symbols in bars represent trends and statistically significant differences among groups after post hoc analysis: *p < 0.05, **p < 0.01, ***p < 0.001, ****p < 0.0001.

