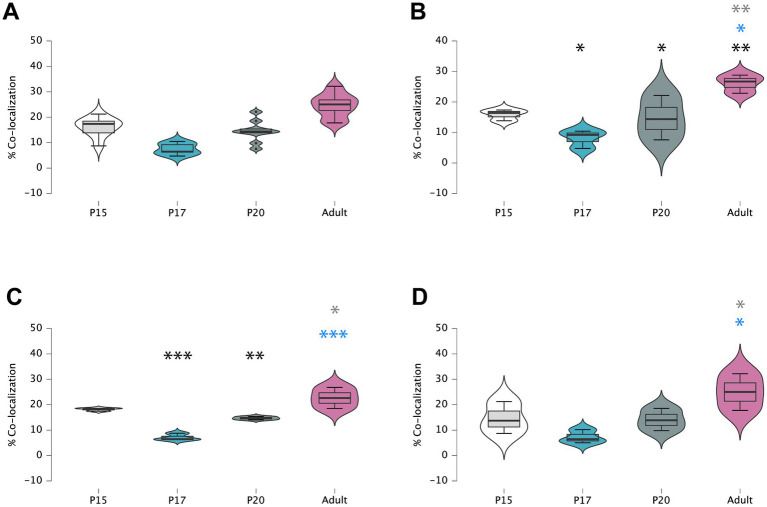
Figure 5.
Violin plots of comparative mean/median values and percentiles of double-labeled RLN3/Syn vs. RLN3 puncta alone (A), in MS (B), VDB (C) and HDB (D). Colored symbols in bars represent trends and statistically significant differences among groups after post hoc analysis: *p < 0.05, **p < 0.01, ***p < 0.001.

