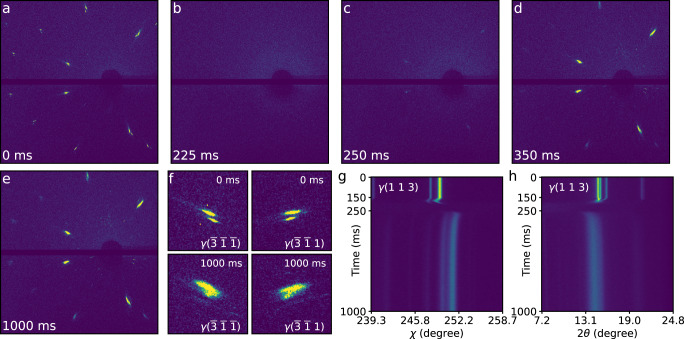
Fig. 2. Time series of the representative Laue diffraction patterns during laser remelting processes.
a–e Laue diffraction images collected at 0 ms (a), 225 ms (b), 250 ms (c), 350 ms (d) and 1000 ms (e). f Local enlarged drawing of the diffraction spots of γ() and γ() lattice planes at 0 and 1000 ms. g, h Variation diagrams of the γ(1 1 3) crystal plane with time in the χ direction (g) and 2θ direction (h). The laser was switched on at 150 ms and off at 250 ms.

