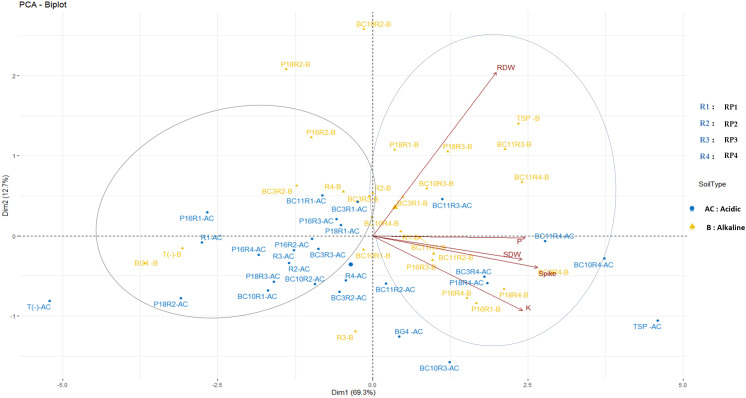
Figure 4.
Principal components analysis of the wheat growth parameters and nutrient content across different Actinomycetota-RPs inoculations in different soil pH. The points represent mean values of 5 replications of each treatment. Arrows indicate directions and strength of parameters in the dataset. SDW, Shoot dry weight; RDW, Root Dry weight.

