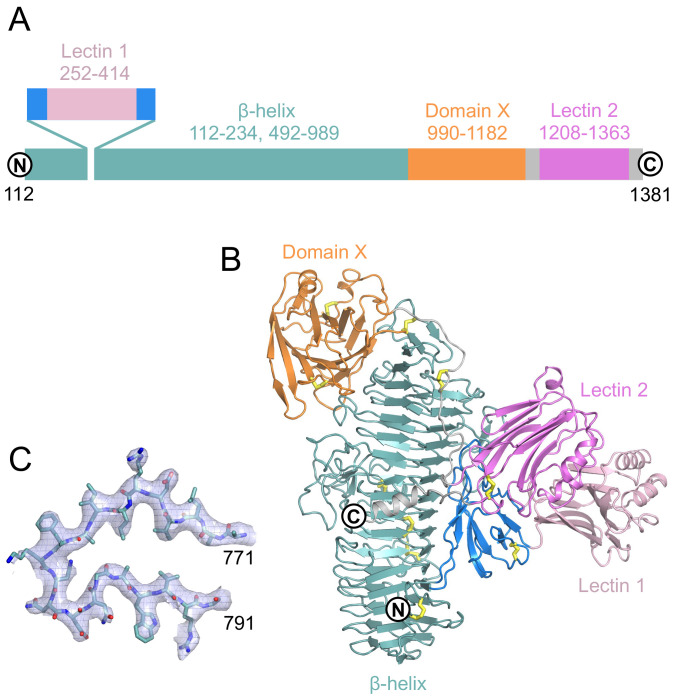
Figure 1. Crystal structure of soluble Transmembrane protein 2 (sTMEM2).
( A) Schematic representation of the sTMEM2 domain structure. Sequence numbers refer to full-length TMEM2. ( B) Cartoon drawing of the sTMEM2 structure using the same colour code as in A. Disulfide bonds are indicated by yellow sticks. N-linked glycans have been omitted for clarity. ( C) Electron density map for residues 771-791. Shown is the final 2 F obs- F calc map contoured at 1 σ level. This figure was produced using PyMOL version 2.5.2. UCSF Chimera is a free alternative to PYMOL.

