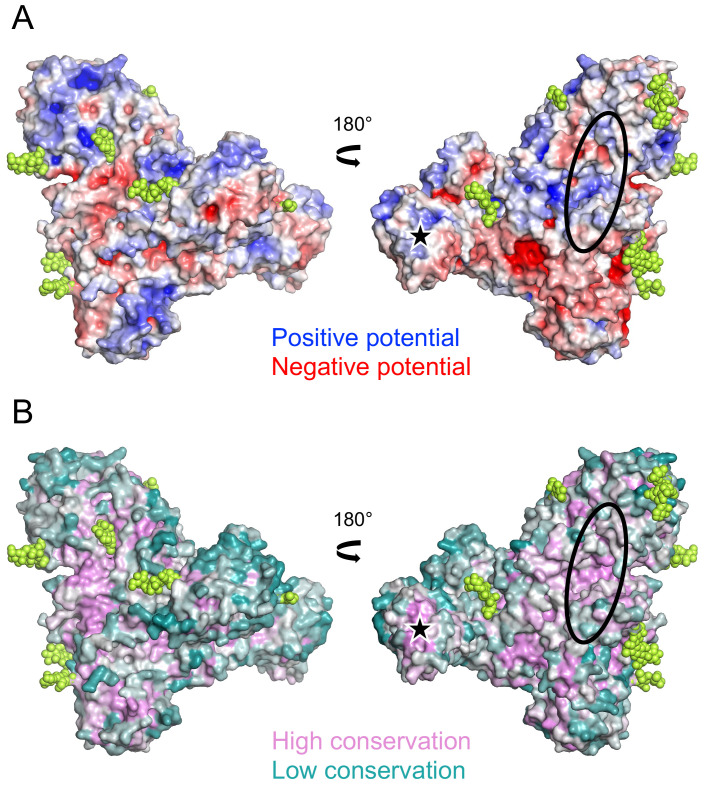
Figure 2. Surface properties of soluble Transmembrane protein 2 (sTMEM2).
( A) Electrostatic surface potential calculated using the APBS function of PyMOL (version 2.4.1). UCSF Chimera is a free alternative to PYMOL. Positive and negative potential is shown in blue and red, respectively. Glycans are shown in lime green. ( B) Sequence conservation calculated using the Consurf server 22 . High and low sequence conservation is shown in magenta and teal, respectively. Glycans are shown in lime green. In A and B, the views on the left are the same as in Figure 1B. The black oval indicates the general location of active sites in related β-helix enzymes (see text). The black star indicates the tip of lectin-like domain 1.

