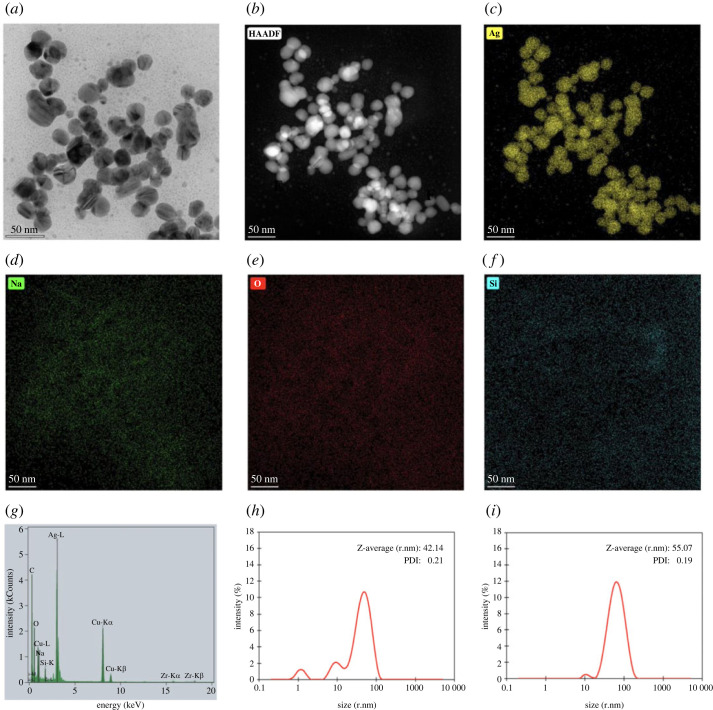
Figure 3.
TEM micrograph (a), high-angle annular dark-field imaging (HAADF) (b), Silver (Ag) EDS image mapping (c), Sodium (Na) EDS image mapping (d), Oxygen (O) EDS image mapping (e), Silicon (Si) EDS image mapping (f) and EDX spectrum (g) of AgNPs obtained from freshly prepared silver colloids, and the hydrodynamic size distribution curves of (h) and AgNPs obtained from (i) freshly prepared silver colloids.

