
Fig. 2.
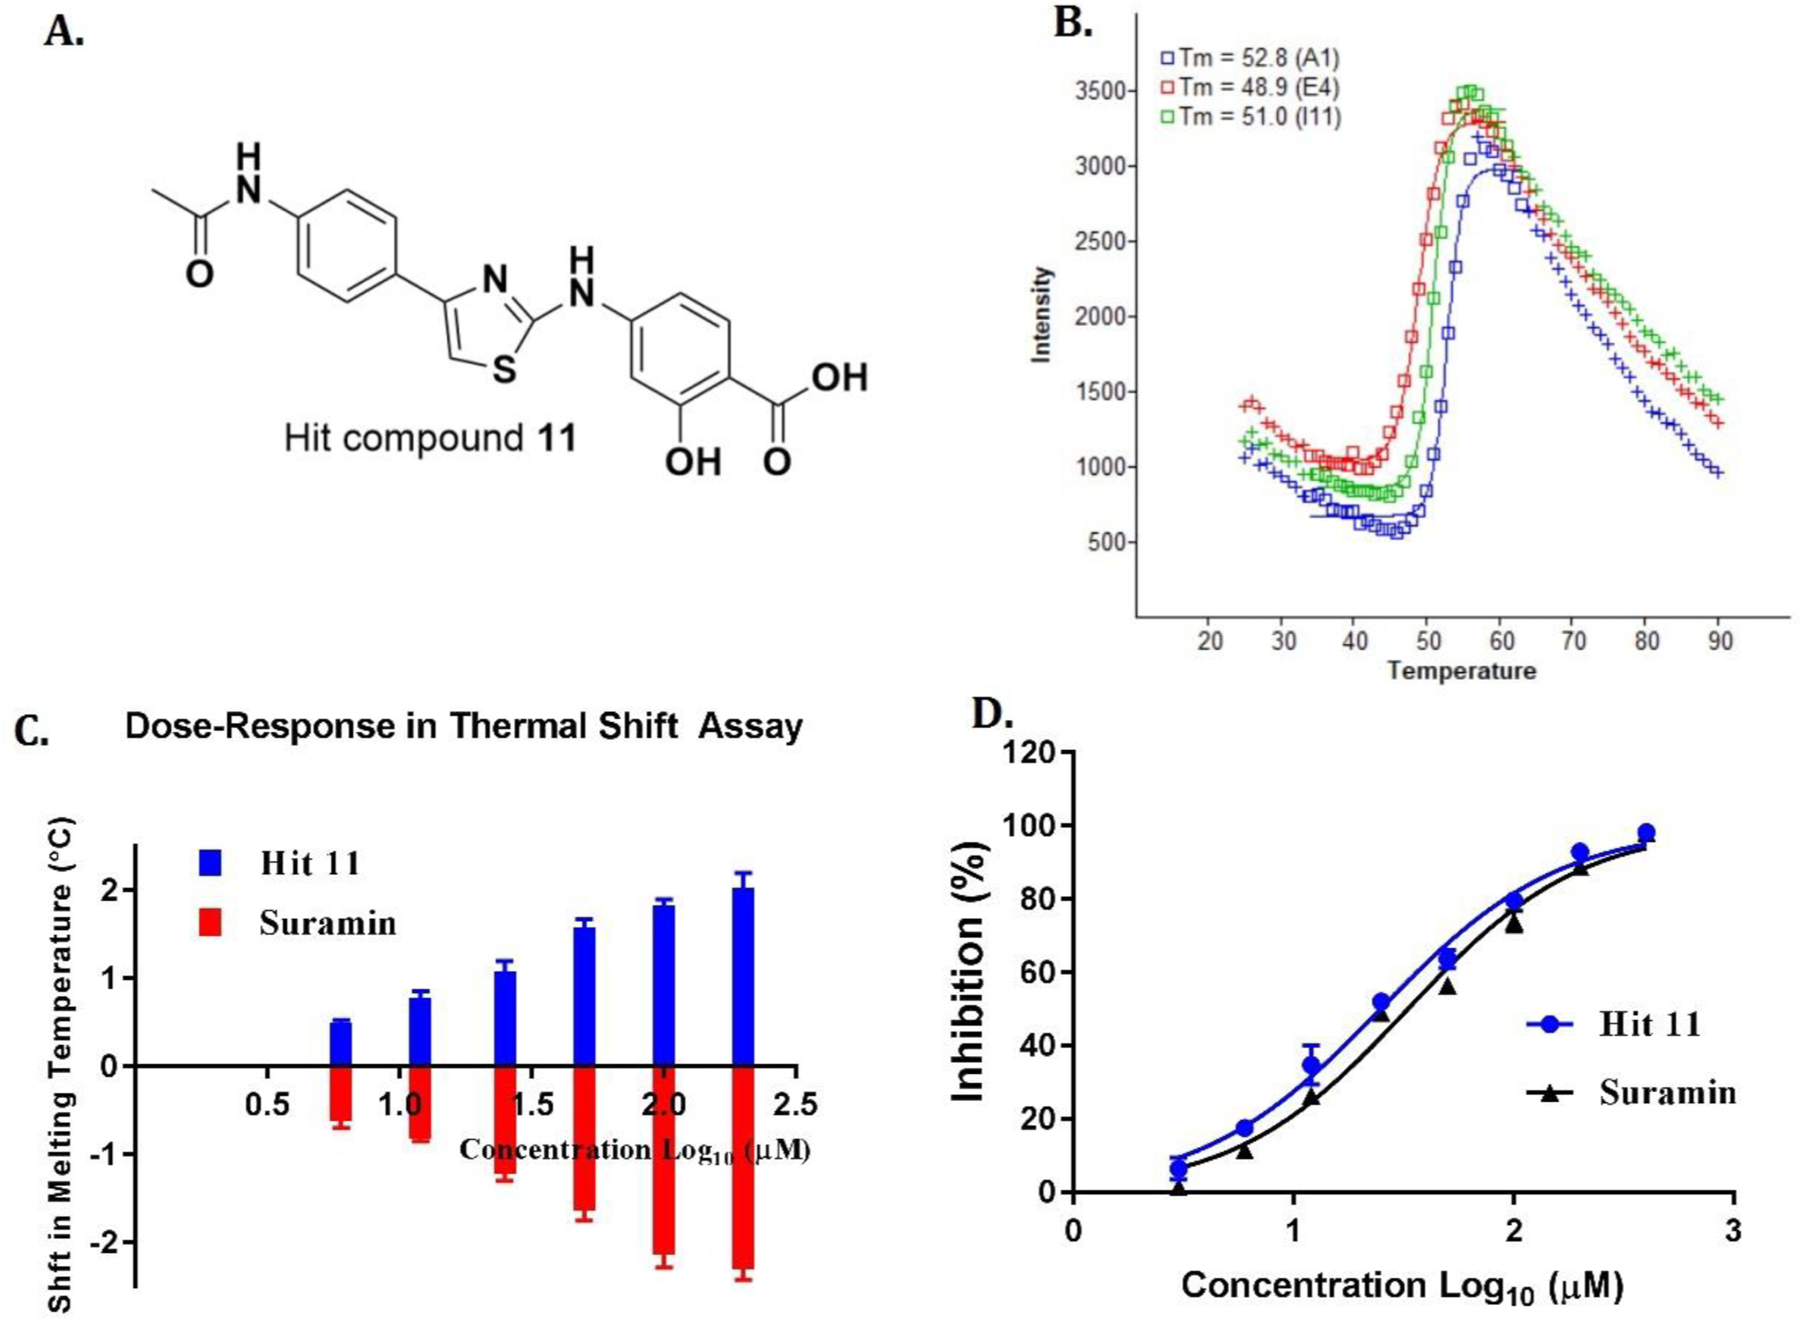
(A) Structure of hit compound 11. (B) Thermal melting curve of 11 at 100 μM versus reference (DMSO) control and a positive control (suramin). A1 (blue curve): sample well contains 11, wild type SIRT5, dye, and buffer; I11 (green curve): reference (DMSO) control well contains DMSO, wild type SIRT5, dye, and buffer; E4 (red curve): positive control well contains suramin, wild type SIRT5, dye, and buffer. The melting curve is presented as fluorescence intensity versus temperature. (C) Concentration-dependent stabilization of SIRT5 by 11. The ΔTm was measured as above using SIRT5 and compound 11 (6–200 μM). The curve represents an exponential fit to the ΔTm values plotted against the compound concentration. (D) Concentration-dependent inhibition of SIRT5 by hit 11. All measurements were done in quadruplicates. Reported SIRT5 inhibitor suramin was used as a positive control.