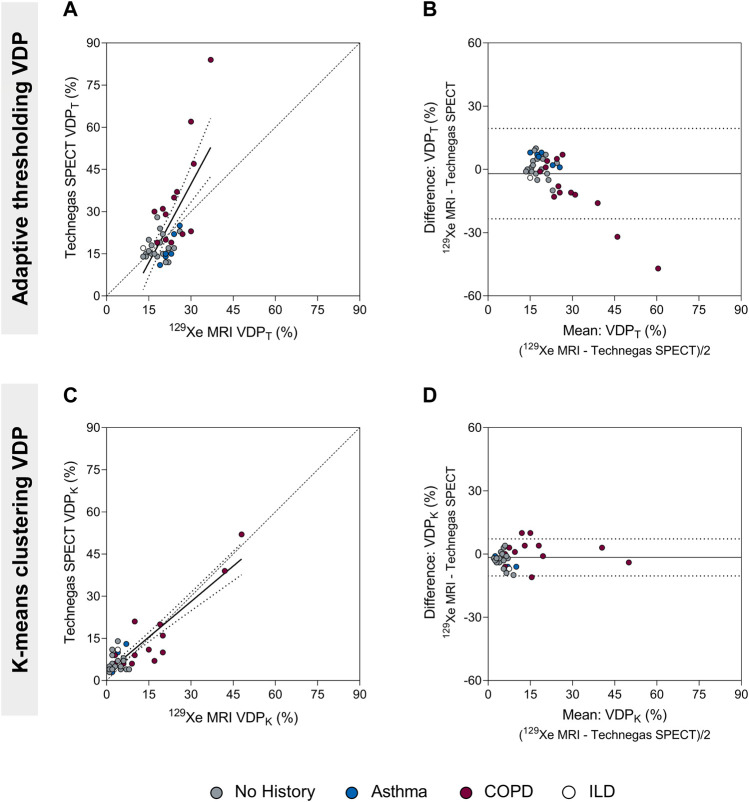
FIGURE 2.
Comparison of the ventilation defect percent (adaptive thresholding (VDPT) and k-means clustering (VDPK)) quantified by Technegas SPECT and 129Xe MRI. (A) Positive relationship between Technegas SPECT and 129Xe MRI VDPT quantified using the adaptive threshold method (r = 0.48, r 2 = 0.49, p = 0.001, y = 1.86x-16.11). (B) Bland-Altman plot of the difference between Technegas SPECT and 129Xe MRI VDPT quantified using the adaptive threshold method. Bias = −2.0% (95% limits of agreement, −23.4% to 19.4%). (C) Positive relationship between Technegas SPECT and 129Xe MRI VDPK quantified using the k-means clustering method (r = 0.63, r 2 = 0.80, p < 0.0001, y = 0.84x+2.83). (D) Bland-Altman plot of the difference between Technegas SPECT and 129Xe MRI VDPK quantified using the k-means clustering method. Bias = −1.6% (95% limits of agreement, −10.4% to 7.2%). For correlation plots, the dashed line represents the line of identity (y = x) and the dotted lines represent the 95% confidence intervals of the linear regression line. For Bland-Altman plots, the solid line represents the mean of the paired differences, and the dotted lines represent the 95% limits of agreement. Colored data points represent history of lung disease (no history, n = 21; asthma, n = 6; COPD, n = 13; ILD: n = 1). *Thresholding (VDPT) and k-means clustering (VDPK) methods previously optimized and validated for Technegas SPECT and 129Xe MRI, respectively.

